Environmental Geophysics
Induced Polarization (IP) and Complex Resistivity
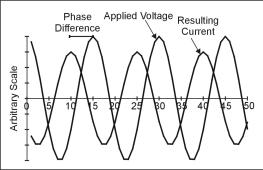
As previously defined, electrical resistivity, r, is the constant of proportionality between the electrical current and the applied electric field (Ohm's Law). If the applied field varies in time, the current behaves similarly. For example, if the applied field is a sinusoid with a zero crossing at time t, then the current will be similar. The implication is that r is independent of the frequency or time behavior of the applied field. In fact, the resistivity (or conductivity) will almost always be frequency dependent to some degree, and is also complex. The resistivity then has the form r(f) =r'(f) + ir"(f). In this case, the current is still linearly proportional to the applied electrical field at each frequency, but it will have a phase shift in its response. In the diagram (figure 1), a complex r has shifted the current sinusoid with respect to the applied field. An equivalent representation of the effects of a complex resistivity is the result of a sharp turn-off of the applied voltage. Normally, the current in the ground would also cease immediately. When the resistivity is complex, the current will continue to flow for a period of microseconds to as much as several seconds in some cases.>
Methods known as induced polarization (I P), spectral I P (SIP), and complex resistivity (CR) or complex conductivity (CC) exploit these more general properties of the resistivity (conductivity) parameter. The process of shifting implies delay between cause and effect, and this, in turn, requires that the energy in the applied field be stored for an instant before being converted into current flow. In an electrical circuit, this storage could be depicted as a capacitor.
 >
>
Figure 1. Schematic of the phase shift between an applied voltage and the resulting current when r is complex.
There are several mechanisms in the earth that enhance this complex, frequency- dependent behavior of resistivity. Disseminated metal ores are by far the most (commercially) important target of I P surveys. The mechanism for storage/delay is at least conceptually related to the blocking of pores by metallic grains. Pore water ions build up on either side of the grain, giving the effect of a capacitor. A similar effect can be observed in some garbage dumps containing a lot of scrap metal. The disseminated metal may not increase the average resistivity substantially but are ged by an applied electric field. Their presence can be recognized by the slow voltage disge after the applied field is turned off. These effects are most pronounced at frequencies below 1,000 Hz. IP effects arising from metallic sources are generally most pronounced at fairly low frequencies (below 100 Hz). However, in conductive terrain, maximum anomalies can occur at higher frequencies. Conductivity ranges of some materials are shown in figure 2.
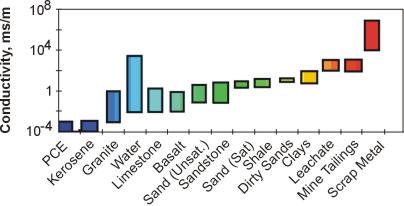
Figure 2. Conductivity ranges of some materials. Note this is a very variable parameter, and the ranges are approximate.>
Olhoeft (1986) describes three other active chemical processes that produce smaller but, in some circumstances, important IP and CR anomalies. In clays, ion exchange processes effectively create different mobilities for cations and anions within the pores. This separates or polarizes charge and is usually known as membrane polarization. This effect is much smaller than is observed for disseminated metals, but can be exploited in some cases to distinguish clay and contaminated aquifers, both of which will have a low direct current (DC) resistivity. Olhoeft (1986) also describes some poorly understood polarization effects that occur when organics react with clay minerals. The most promising aspect of this, from the standpoint of detecting organic wastes, is that measurable reduction of the IP response of clays following organic contamination has been recorded. The effect, however, is subtle.>
It is usual to talk of complex resistivity instead of complex conductivity, although this is an arbitrary choice. The simplest of complex resistivity units are ohm meters, but measured as a real (r') and imaginary (r") part and as a function of frequency. Alternatively, it is convenient to consider the resistivity as having a magnitude |r| = (r'2+ r "2)1/ 2 [ohm · meters] and a phase lag or lead f = tan-1(r''/r') [radians or, more practically, milli-radians].
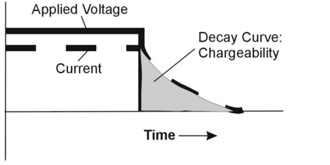
Figure 3. Schematic of decay time associated with complex resistivity, IP.
In IP surveys, the percentage frequency effect PFE is defined as the normalized difference between the resistivity measured at two different frequencies (typically 0.1Hz and 10Hz). A related parameter, the chargeability(m), is measured by systems that record the time delay in current flow following an abrupt interruption or onset of the applied voltage. chargeability is a measure of the area under the decay curve in figure 3.
Figure 4 shows the CR response of a montmorillonite (clay) soil from the EPA Pittman site near Henderson, Nevada, taken from Olhoeft (1986). One of the two samples (triangles) is contaminated by waste that includes organics. Note the decrease in resistivity with frequency and the presence of a phase peak for both samples, consistent with the theoretical response of Figure 3. The contamination has lowered the resistivity of the second sample - clearly inorganic contaminants dominate - but the shift of the phase peak to lower frequencies is stated by the author to represent peptization, a process whereby organic molecules preferentially attach themselves to the clay surfaces, inhibiting cation exchange.
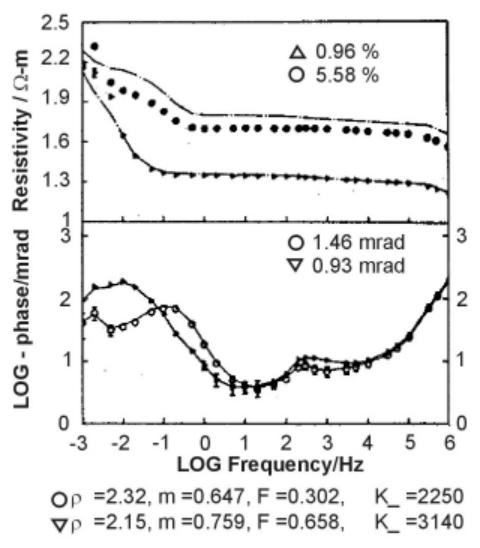
Figure 4. Variation of resistivity (upper) and phase as function of frequency for some montmorillonite clays (from Olhoeft, 1986).
The pages found under Properties are substantially based on a report produced by the United States Department of Transportation:
Wightman, W. E., Jalinoos, F., Sirles, P., and Hanna, K. (2003). "Application of Geophysical Methods to Highway Related Problems." Federal Highway Administration, Central Federal Lands Highway Division, Lakewood, CO, Publication No. FHWA-IF-04-021, September 2003. http://www.cflhd.gov/resources/agm/
