
|
Cost and Performance
Report:
|
Preparation of this report has been funded wholly or in part by the U.S. Environmental Protection Agency under Contract Number 68-W3-0001. It has been subject to administrative review by EPA headquarters and Regional staff and by the technology vendor. Mention of trade names for commercial products does not constitute endorsement or recommendation for use.
This report presents cost and performance data for a slurry phase bioremediation application at the Southeastern Wood Preserving Superfund site, in Canton, Mississippi. Slurry phase bioremediation was used at the Southeastern Wood site to treat soil and sludge contaminated with polynuclear aromatic hydrocarbons (PAHs), including acenaphthene, acenaphthylene, anthracene, benzo(a)anthracene, benzo(b and k)fluoranthenes, benzo(ghi)perylene, benzo(a)pyrene, chrysene, dibenzo(a,h)anthracene, fluoranthene, fluorene, indeno(1,2,3-cd)pyrene, naphthalene, phenanthrene, and pyrene.
The Southeastern Wood site was the location of a creosote wood preserving facility that operated from 1928 to 1979, and included three unlined wastewater treatment surface impoundments. Bottom sediment sludge from the impoundments was found to contain PAHs at levels of approximately 4,000 mg/kg, and was identified as a RCRA K001-listed hazardous waste. PAH concentrations measured included acenaphthene at 705 mg/kg, naphthalene at 673 mg/kg, and benzo(a)pyrene (B(a)P) at 224 mg/kg.
The application at Southeastern Wood was completed as a removal action, under an action memorandum signed in September 1990. A slurry phase bioremediation system was operated from July 1991 until 1994, and consisted of a power screen, a slurry mix tank, four slurry phase bioremediation reactors (bioreactors), and a slurry dewatering unit. The bioreactors were 38 feet in diameter and 24 feet in height, and were equipped with a blower for aeration and an impeller for mixing and keeping the slurry in suspension. Cleanup goals for this application were developed based on the results of laboratory and field pilot tests and a site-specific health-based risk analysis, and consisted of the following: total PAHs - 950 mg/kg, and B(a)P-equivalent PAHs - 180 mg/kg. These goals were provided in an LDR treatability variance for this application.
The bioreactors were operated on a batch basis, and each batch was monitored during treatment to evaluate performance with respect to the cleanup goals. Treatment performance data are available for 13 of the 61 bioreactor batches, and show that the average total PAH concentration was reduced from 8,545 to 634 mg/kg, which corresponds to a treatment efficiency of 93 percent. The average B(a)P-equivalent concentration was reduced from 467 to 152 mg/kg, or 67 percent. The analytical data indicate that the majority of biodegradation occurred during the first 5 to 10 days of treatment, and the cleanup goal for total PAHs was met for 12 of the 13 batches within approximately 19 days of treatment.
Approximately $2,900,000 were expended in this application, consisting of $2,400,000 for activities directly attributed to treatment (mobilization/setup, startup/testing/permits, and operation), and $500,000 for after-treatment activities (site restoration). The cost for activities directly attributed to treatment corresponds to $170 per ton ($230 per cubic yard) of soil and sludge treated (14,140 tons, or 10,500 cubic yards).
Table of Contents | Forward to Site Information
Southeastern Wood Preserving Superfund Site
Canton, Mississippi
CERCLIS # MSD0008258558
Action Memorandum Date: 9/30/90
Type of Action: Removal
Treatability Study Associated with Application? Yes (see additional
information under Background and Operation below)
EPA SITE Program Test Associated with Application? No
Operating Period: 1991-1994
Quantity of Soil Treated During Application: 14,140 tons (10,500 cubic
yards) of soil and sludge
Historical Activity That Generated Contamination at the Site:
Creosote wood preserving
Corresponding SIC Code: 2491B (Wood Preserving Using Creosote)
Waste Management Practices That Contributed to Contamination:
Manufacturing Process, Surface Impoundment/Lagoon
Site History: The Southeastern Wood Preserving Superfund Site is an abandoned wood preserving facility located in Canton, Mississippi, as shown in Figure 1. The facility was used for creosote wood preserving activities between 1928 and 1979. In 1986, EPA initiated an emergency response action at the site to stabilize three unlined surface impoundments which were overflowing.
The impoundments were dewatered and bottom sediment sludge was excavated and stabilized using approximately 70 cubic yards of cement kiln dust.
Excavation was based on a visual assessment of contamination. EPA sampled this material in April 1989, and found it to be contaminated with polynuclear aromatic hydrocarbons (PAHs), at levels of approximately 4,000 mg/kg, as shown in Table 1. The contaminated material from the lagoon was classified as a RCRA K001-listed hazardous waste (bottom sediment sludge from the treatment of wastewaters from wood preserving processes which used creosote). The excavated material was stockpiled on site for further treatment. [1, 2, 12]
Regulatory Context: This application was conducted as part of a removal action at the site. Cleanup goals were developed based on the results of bench-scale and field pilot studies using bioremediation and a site-specific health-based risk analysis.
Remedy Selection: Slurry-phase bioremediation was selected for this application on the basis of cost. In addition, slurry-phase bioremediation was identified as preferable to land treatment because it was believed to treat the soil in a shorter period of time and to achieve lower concentrations in the residual soil. [4, 9]
Table 1. Concentrations of PAHs in Excavated Material* [12]
Constituent |
Concentration (mg/kg) |
|---|---|
| Acenaphthene | 705 |
| Acenaphthylene | 78.8 |
| Anthracene | 2.44 |
| Benzo(a)anthracene | 496 |
| Benzo(b)fluoranthene/ Benzo(k)fluoranthene | 513 |
| Benzo(ghi)perylene | 9.8 |
| Benzo(a)pyrene | 224 |
| Chrysene | 305 |
| Dibenzo(ah)anthracene | 27.05 |
| Fluoranthene | 419 |
| Fluorene | 32.2 |
| Indeno(1,2,3-cd)pyrene | 64.1 |
| Naphthalene | 673 |
| Phenanthrene | 266 |
| Pyrene | ND (0.36) |
| Total PAHs | 3,815 |
ND - Not detected. Value in parentheses is the reported detection
limit.
*Sample collected April 4, 1989.
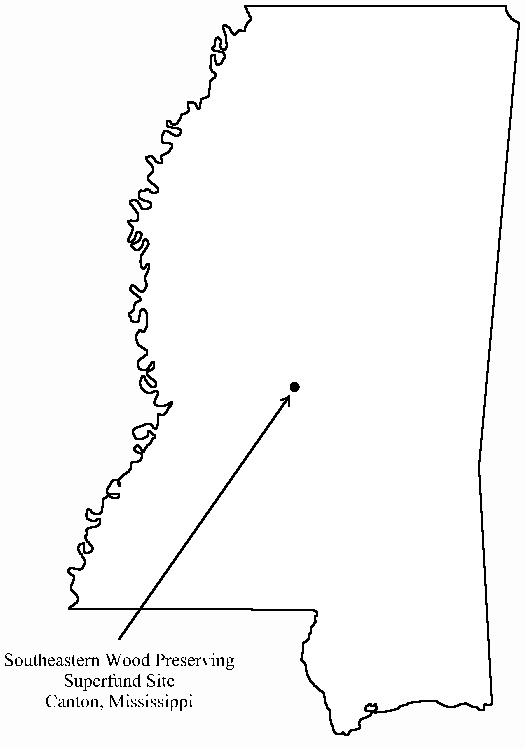
Figure 1. Site Location[1]
Site Management: Fund-Lead
Oversight: EPA
On-Scene Coordinator: R. Donald Rigger
USEPA Region 4
345 Courtland Street, N.E.
Atlanta, GA 30365
(404) 347-3931
Treatment System Vendor: Douglas E. Jerger/Pat Woodhull
OHM Remediation Services Corp.
16406 U.S. Route 224 East
P.O. Box 551
Findlay, OH 45840
(419) 425-6175
Back to Executive Summary |
Table of Contents | Forward to Matrix Description
Type of Matrix Processed Through the Treatment System: soil (ex situ) and sludge (ex situ)
Primary Contaminant Group: Polynuclear Aromatic Hydrocarbons (PAHs)
The excavated material at the site contained PAH concentrations of approximately 4,000 mg/kg dry weight for total PAHs and from 1,000 to 2,500 mg/kg dry weight carcinogenic PAHs. Total PAHs are defined as the sum of the 16 constituents listed below. Carcinogenic PAHs are defined as the total concentration of the seven PAHs marked with an asterisk: [3]
|
|
The major matrix characteristics affecting cost or performance for this technology and the values measured for each are shown in Table 2.
Table 2. Matrix Characteristics [2, 9, 12]
Parameter |
Value |
Measurement Method |
|---|---|---|
| Soil Classification | Information not provided |
Information not provided |
| Clay Content and/or Particle Size Distribution* | >10 mesh (gravel) 5% |
Information not provided |
| Bulk density (of stockpiled material) | 1.83 gm/cm3 |
ASTM-D1298 |
| Ash | 66.8% |
ASTM-D482 |
| Sulfur | 0.08% |
ASTM-D129 |
| Free liquids | None |
SW-846-9095 |
| Total Solids | 71.5% |
SM-209F |
*Information was not provided in the available references on whether this distribution was for soil excavated from the site and/or treated in the bioreactors.
Various types of debris were present in the contaminated soil and sludge excavated at the site. The debris included large stones, plastic sheeting, concrete, and railroad ties. [2]
Back to Site Information | Table of Contents | Forward to Treatment System Description
Slurry phase bioremediation
Pretreatment (Solids): screening, mixing
Post-Treatment (Solids): dewatering
The slurry phase bioremediation system used at Southeastern Wood Preserving included a power screen, a slurry mix tank, four slurry phase bioremediation reactors (bioreactors), and a slurry dewatering unit. This system, shown in Figure 2, was used to separate out the larger particles (greater than 200 mesh, or 0.0029 inches) from the stockpiled soil and sludge, and to biologically treat the remaining soil and sludge particles (less than 200 mesh).
As shown on Figure 2, soil and sludge from the stockpile were power-screened to remove debris greater than 0.5 inches such as large stones, plastic sheeting, and railroad ties. The power-screening step removed approximately 450 cubic yards of material.
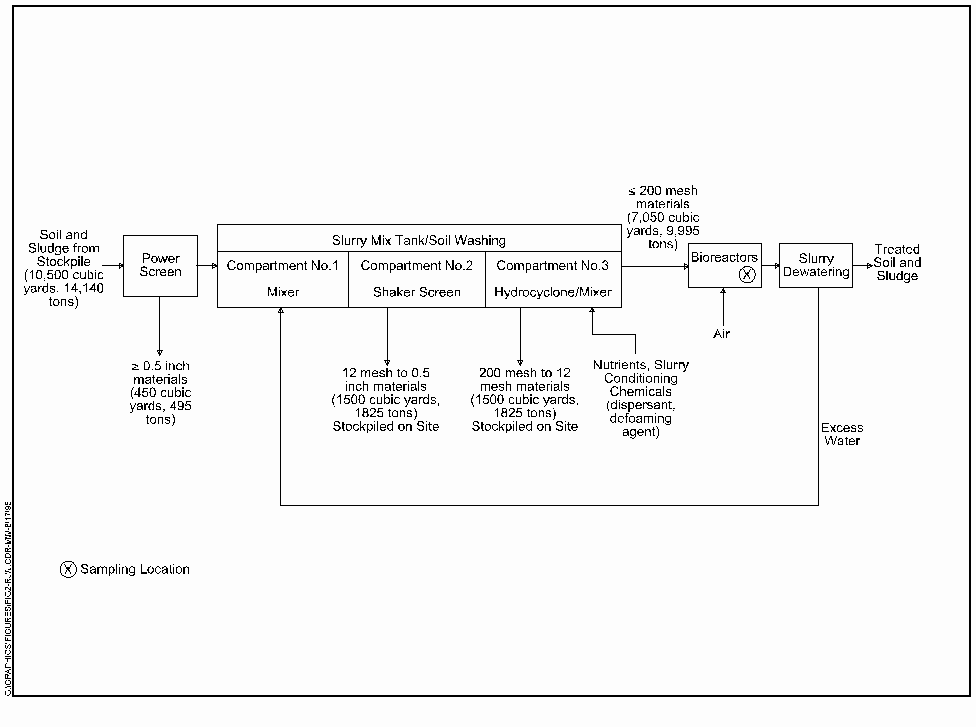
Figure 2. Slurry Phase Bioremediation System Used at Southeastern Wood Preserving [6]
Soil and sludge that passed the power screening step were loaded into a
slurry mix tank for soil washing. The mix tank contained three
compartments:
In addition, nutrients and slurry conditioning chemicals (including a dispersant and defoaming agent) were added and mixed with the slurry in this compartment.
Materials removed by the shaker screen and hydrocyclone were stockpiled on site.
The slurry mixing/soil washing process was performed on a batch basis, with 20-30 minutes of processing time per batch.
Four closed-top bioreactors were used in this application. Each bioreactor was 38 feet in diameter and 24 feet in height, and was equipped with diffusers and a blower for aeration and an impeller for mixing and keeping the slurry in suspension. Each bioreactor had an operating capacity of 180,000 gallons. The system was operated on a batch process, with each batch consisting of 160 to 180 cubic yards of material. Sixty-one batches were treated in this application, consisting of 17 batches in reactor 1, 23 batches in reactor 2, 14 batches in reactor 3, and 7 batches in reactor 4. During treatment, the slurry in the reactors was monitored daily for pH, temperature, dissolved oxygen, and other biological monitoring parameters, such as nutrient and biomass concentrations. Operating parameters and values for this application are shown in Table 3.
Excess water generated in the bioreactors was occasionally removed from the reactors. This excess water was first sampled, and, as appropriate, discharged to a POTW.
Construction of the treatment facilities began in January 1991 and was completed in mid-April 1991. Demonstration testing began at that time and consisted of batch treatment of 700 cubic yards of soil. By late June 1991, the treatment vendor had demonstrated that the soil could be treated in the reactors to the cleanup standards set in the contract. During the demonstration tests, the vendor also evaluated the performance of a land treatment unit (LTU) for this application. However, soil applied directly to the LTU did not meet the cleanup standards within this timeframe. In order to complete the demonstration test and receive EPA authorization to proceed with the project, the vendor decided to forego applying soil directly to the LTU and treated all soil in the reactors.
Operation of the full-scale soil treatment system began in July 1991. During full-scale operation, the vendor refined the operation by adding a slurry mix tank/soil washing (desanding) operation. The vendor found that keeping sand-sized particles in suspension in the reactors was extremely difficult, and they removed the sand prior to pumping the slurry to the reactors. The sand was analyzed separately and subject to the same clean up criteria as the fine grained particles.
Soon after full-scale operation began, the vendor began to have problems meeting the clean up standards within the anticipated 30 to 35 day reactor residence time. Specifically, problems were encountered with two compounds, pyrene and phenanthrene, which both have a K001 treatment standard of 1.5 mg/kg. The vendor identified non-homogeneity in the contaminated soil stockpile as the cause. During this early period of system operation, reactor residence time was running in the 60 to 80 day range. This problem was resolved by modifying the cleanup standards to be based on total PAH concentrations (i.e., the sum of 16 specific PAHs). This was accomplished by removing the K001 treatment standards - see additional discussion under Cleanup Goals.
Progress of the bioremediation process was measured using oxygen uptake rate (OUR). When the OUR showed a significant decline, the vendor would collect samples for chemical analysis.
The vendor noted that there was a problem with foam production during bioreactor operation. Foam would overflow the bioreactors, and the vendor had trouble containing the overflow. To correct this problem, the combination of dispersant and defoamer was revised, including addition of a lignin.
The bioreactors were located outdoors, and operated year round, but were not heated. The vendor specified that during the colder winter months, much slower degradation was observed. The bioreactor temperature ranged from 15°C to 21°C during the winter months. During the spring, summer, and fall, bioreactor temperatures ranged from 25°C to 40°C.
Air Dispersion Modelling [11]
To assess emissions of volatile organic compounds (VOCs) and PAHs from the bioremediation process, the treatment vendor performed air dispersion modeling. The vendor modeled off-property ground-level VOC and PAH concentrations using the EPA Industrial Source Complex (ISC) dispersion simulation model. The results of the modeling showed that proposed activities would not result in any exceedence of accepted long-term exposure screening levels for this application.
Slurry Dewatering [9]
After treatment in the bioreactors, the slurry was transferred to a slurry dewatering unit, which was a 425-foot long, 160-foot wide, and 6-foot deep high density polyethylene (HDPE)-lined cell. The water recovery system, consisting of drain tiles in coarse sand, was sloped to a sump to collect excess water. Excess water was pumped to a 350,000-gallon water management tank and was reused for slurry preparation. Soil remaining in the slurry dewatering unit was tilled to further dry the treated material.
Treated soil and sludge were placed in a lined, capped disposal cell on site. Debris and sand were also placed in the cell.
The major operating parameters affecting cost or performance for this technology and the values measured for each are shown in Table 3.
Table 3. Bioreactor Operating Parameters [1, 2, 16]
| Parameter | Value |
Measurement Method |
|---|---|---|
| Air Flow Rate (SCFM) | 350 ± 100 |
N/A |
| pH | 7.2 ± 1.0 |
N/A |
| Residence Time (days) | 8 to 29 |
N/A |
| System Throughput (yd3 per batch) | 160 to 180 |
N/A |
| No. of Batches Treated | 61 |
N/A |
| Temperature (°C) | 15 - 40 |
N/A |
| Biomass Concentration (cfu/ml) | 107 - 108 |
Information not provided |
| Hydrocarbon Degradation | Not measured |
--- |
| Operating Volume (gallons) | 180,000 |
N/A |
| Impeller Speed (RPM) | 900 |
N/A |
| Solids Loading % | 20 |
N/A |
| Initial Defoamer (mg/L) | 200 |
N/A |
| Initial Dispersant (mg/L) | 1,000 |
N/A |
| Dissolved Oxygen (mg/L) | >2.0 |
N/A |
| NH4-N (mg/L) | 60 ± 20 |
Information not provided |
| PO4-P (mg/L) | 10 |
Information not provided |
N/A - Measurement method not reported for this parameter because resulting value not expected to vary among measurement methods.
A timeline for this application is shown in Table 4.
Start Date |
End Date | Activity |
|---|---|---|
1928 |
1979 |
Southeastern Wood Preserving operated as creosote wood treatment facility |
April 1989 |
--- |
Initial samples collected from excavated materials |
September 1990 |
--- |
Action memorandum signed |
January 1991 |
April 1991 |
Treatment facility construction |
April 1991 |
June 1991 |
Demonstration tests performed |
July 1991 |
1994 |
Slurry phase bioremediation of soil and sludge performed |
No additional details on the timeline for this application (e.g., for bioremediation activities) are provided in the available references.
Back to Matrix Description | Table of Contents | Forward to Treatment System Performance
The results of laboratory and field pilot tests and a site-specific
health-based risk analysis were used to develop the following cleanup goals for
this application:
Total PAHs were defined in this application as the sum of the concentrations for the 16 constituents shown in Table 7. EPA used published toxicity-equivalent factors to calculate the B(a)P-equivalent of the carcinogenic PAHs (the carcinogenic PAHs are identified in Table 7). In calculating B(a)P-equivalent concentrations, the concentration of each PAH is multiplied by a factor which is equal to its carcinogenicity relative to benzo(a)pyrene. The resulting weighted concentrations are summed to calculate the B(a)P-equivalent carcinogenic PAH value. [6, 7]
In addition, the cleanup goals allowed 15% of the treated soil to have a total PAH concentration less than 1,100 mg/kg, and 25% of the treated soil to have a B(a)P-equivalent concentration less than 230 mg/kg. [2, 6]
At the beginning of this application, soil was classified as RCRA hazardous waste K001. However, in February 1992, soon after full-scale operation began, an LDR treatability variance was obtained so that the soil would not need to be treated to meet the LDR treatment standards for K001. The treatability variance was obtained under 40 CFR Section 268.44, and resulted in the cleanup goals for total and carcinogenic PAHs shown above. Additional information is provided in reference 10 on the process used to obtain the variance. [10, 26]
Treatment performance data are available from 13 of the 61 bioreactor batches. Slurry samples were collected at the start of biotreatment and on a periodic basis during treatment. The sampling point for slurry samples is marked on Figure 2 with an “X.” No additional information on how samples were collected is provided in the available references.
Table 5 presents the initial concentrations of PAHs in the slurry, and Table 6 presents the concentrations of PAHs in the slurry after treatment had occurred. [NOTE: No information is provided in the available references to explain how specific days were selected for use in calculating treatment efficiency - e.g., how Day 10 was selected for calculating treatment efficiency for bioreactor batch R1 B5; what data were used to select this day; or why treatment continued beyond this date.] Tables 5 and 6 show the concentrations of 16 individual PAH constituents measured in each of the bioreactor batches, as well as the sum of the concentrations for all 16 PAHs and for the 7 carcinogenic PAHs, and the B(a)P-equivalent for the sum of the 16 PAHs. The average concentration of each PAH is also shown on these tables. Figures 3 through 8 show the total PAH concentrations as a function of time for the first six batches shown in Tables 5 and 6, based on data in References 2 and 24.
Table 7 presents a summary of the PAH treatment performance data for the first six batches according to the number of rings in the PAH constituent (two, three, four, or five and six ring PAHs). This table shows the cleanup goals for this application, and the average results for PAHs at the start of treatment (from Table 5) and after treatment (from Table 6). The treatment efficiency included in the table was calculated based on the reduction in concentration for these average results.
No data are provided in the available references to characterize the performance of the soil washing step.
For the 13 batches with available data, the average total PAH concentration was reduced from 8,545 mg/kg to 634 mg/kg, which corresponds to a treatment efficiency of 93 percent. The average B(a)P-equivalent concentration was reduced from 467 mg/kg to 152 mg/kg, or 67 percent. Carcinogenic PAHs showed a similar reduction, from 1,160 mg/kg to 374 mg/kg, or 67 percent.
Table 6 shows that 12 of the 13 bioreactor batches met the cleanup goal of 950 mg/kg for total PAHs; for the 12 batches, total PAH concentrations ranged from 421 mg/kg to 898 mg/kg. For batch R1 B7, the total PAH concentration on Day 20 was 1,126 mg/kg, exceeding the maximum cleanup goal. According to the OSC, further treatment was performed on this batch, however, additional data on treatment performance for this batch are not provided in the available references. [26]
Table 5. Concentrations of PAHs in Slurry at Start of Treatment [2, 24]
|
Bioreactor/Batch ID# |
||||||||||||
|---|---|---|---|---|---|---|---|---|---|---|---|---|---|
R1 B5 |
R1 B8 |
R1 B9** |
|
|
|
|
|
R1 B7 |
|
|
|
|
|
Constituent |
Concentration (mg/kg Dry Weight) |
||||||||||||
| Acenaphthene | 642 |
968 |
692 |
892 |
1,280 |
981 |
465 |
574 |
723 |
508 |
1,440 |
846 |
949 |
| Acenaphthylene | 34 |
ND |
28 |
ND(59) |
ND(223) |
ND(51) |
ND(155) |
37.2 |
31.9 |
ND(50.5) |
ND(373) |
ND |
ND(120) |
| Anthracene | 1,050 |
1,560 |
2,140 |
2,280 |
2,340 |
2,330 |
1,540 |
1,720 |
1,620 |
1,580 |
2,870 |
2,020 |
1,490 |
| Benzo(a)anthracenec | 224 |
287 |
283 |
237 |
370 |
277 |
327 |
279 |
230 |
245 |
597 |
241 |
279 |
| Benzo(b)fluoranthenec/ Benzo(k)fluoranthene*c | 367 |
337 |
278 |
296 |
345 |
304 |
233 |
323 |
344 |
290 |
710 |
287 |
349 |
| Benzo(ghi)perylene | 21 |
ND |
33 |
ND(59) |
ND(223) |
ND(51) |
ND(155) |
ND(32.7) |
20.8 |
ND(50.5) |
ND(373) |
ND |
ND(120) |
| Benzo(a)pyrenec | 92 |
ND |
105 |
100 |
ND(223) |
98 |
ND(155) |
98.2 |
87.4 |
81.5 |
ND(373) |
94.7 |
ND(120) |
| Chrysenec | 228 |
302 |
301 |
247 |
397 |
302 |
316 |
297 |
254 |
225 |
573 |
257 |
310 |
| Dibenzo(ah)anthracenec | 15 |
ND |
ND(40) |
ND(59) |
ND(223) |
ND(51) |
ND(155) |
ND(32.7) |
14.6 |
ND(50.5) |
ND(373) |
ND |
ND(120) |
| Fluoranthene | 1,060 |
1,570 |
1,950 |
1,850 |
2,210 |
1,610 |
1,590 |
1,850 |
1,260 |
1,490 |
3,470 |
1,810 |
1,630 |
| Fluorene | 181 |
669 |
499 |
661 |
1,040 |
732 |
195 |
204 |
663 |
281 |
483 |
850 |
833 |
| Indeno(1,2,3-cd)pyrenec | 30 |
ND |
40 |
ND(59) |
ND(223) |
ND(51) |
ND(155) |
35.4 |
28.2 |
ND(50.5) |
ND(373) |
ND |
ND(120) |
| Naphthalene | 19 |
ND |
ND(40) |
ND(59) |
ND(223) |
ND(51) |
ND(155) |
ND(32.7) |
24.7 |
ND(50.5) |
ND(373) |
87.3 |
ND(120) |
| Phenanthrene | 220 |
1,250 |
395 |
2,030 |
1,300 |
988 |
253 |
279 |
1,360 |
272 |
639 |
2,710 |
1,680 |
| Pyrene | 878 |
1,080 |
1,220 |
1,010 |
1,610 |
1,090 |
1,130 |
1,270 |
974 |
950 |
2,430 |
989 |
1,080 |
| Total PAHs | 5,061 |
8,512 |
8,004 |
9,751 |
11,561 |
8,840 |
6,694 |
7,016 |
7,636 |
6,023 |
14,331 |
10,326 |
8,960 |
| Total Carcinogenic PAHs | 956 |
1,171 |
1,027 |
939 |
1,447 |
1,032 |
1,109 |
1,049 |
958 |
892 |
2,440 |
947 |
1,118 |
| Benzo(a)pyrene Equivalent | 245 |
585 |
295 |
334 |
818 |
318 |
570 |
268 |
245 |
283 |
1,313 |
349 |
454 |
cCarcinogenic PAHs.
*Sum of b and k isomers reported.
**The vendor specified that some concentration values were estimated for this
batch. However, which values were estimated was not specified.
ND - Not detected. Value in parentheses is the reported detection limit. For
calculation of averages and totals, ½ the detection limit was used for
values that were not detected.
Table 6. Concentrations of PAHs in Slurry After Treatment [2, 24]
|
Bioreactor/Batch ID# |
||||||||||||
|---|---|---|---|---|---|---|---|---|---|---|---|---|---|
R1 B5 |
R1 B8 |
R1 B9 |
R1 B10 |
R2 B9 |
R2 B10 |
R1 B4 |
R1 B6 |
R1 B7 |
R2 B5 |
R2 B6 |
R2 B7 |
R2 B8 |
|
Constituent |
Concentration (mg/kg Dry Weight) |
||||||||||||
| Acenaphthene | ND(7) |
ND(14) |
ND(16) |
9 |
ND(7) |
ND(13) |
ND(11.3) |
ND |
ND |
ND |
ND(27.3) |
ND(12.3) |
ND(22.7) |
| Acenaphthylene | 11 |
13 |
ND(16) |
19 |
14 |
23 |
12.1 |
6.63 |
ND |
10.5 |
ND(27.3) |
ND(12.3) |
ND(22.7) |
| Anthracene | 104 |
55 |
102 |
230 |
135 |
100 |
115 |
125 |
229 |
84.1 |
39.6 |
89.3 |
68.2 |
| Benzo(a)anthracenec | 10 |
ND(14) |
ND(16) |
20 |
10 |
16 |
16.5 |
ND |
ND |
12 |
ND(27.3) |
ND(12.3) |
ND(22.7) |
| Benzo(b)fluoranthenec/ Benzo(k)fluoranthene*c |
155 |
240 |
131 |
254 |
259 |
213 |
138 |
95 |
476 |
149 |
282 |
166 |
226 |
| Benzo(ghi)perylene | 23 |
26 |
25 |
ND(7) |
ND(7) |
29 |
22 |
13.9 |
ND |
18 |
ND(27.3) |
14.8 |
ND(22.7) |
| Benzo(a)pyrenec | 52 |
80 |
74 |
95 |
91 |
82 |
63.6 |
46 |
83.4 |
38.9 |
82.9 |
49.8 |
70.6 |
| Chrysenec | 24 |
55 |
30 |
41 |
33 |
31 |
57.1 |
31.1 |
69.6 |
18.2 |
61.6 |
33.8 |
57.4 |
| Dibenzo(ah)anthracenec | 10 |
ND(14) |
ND(16) |
ND(7) |
ND(7) |
20 |
ND(11.3) |
ND |
ND |
ND |
ND(27.3) |
ND(12.3) |
ND(22.7) |
| Fluoranthene | 25 |
32 |
26 |
31 |
37 |
43 |
41.3 |
21 |
40.2 |
37 |
26 |
21.4 |
24.9 |
| Fluorene | 14 |
ND(14) |
ND(16) |
25 |
16 |
15 |
ND(11.3) |
16.2 |
ND |
ND |
ND(27.3) |
ND(12.3) |
ND(22.7) |
| Indeno(1,2,3-cd)pyrenec | 28 |
33 |
31 |
31 |
24 |
40 |
28.3 |
17.9 |
ND |
23.6 |
33.1 |
19 |
30.7 |
| Naphthalene | ND(7) |
ND(14) |
ND(16) |
9 |
ND(7) |
ND(13) |
ND(11.3) |
ND |
ND |
ND |
ND(27.3) |
ND(12.3) |
ND(22.7) |
| Phenanthrene | 27 |
14 |
23 |
79 |
30 |
31 |
22.3 |
24.6 |
53.9 |
19.9 |
11.3 |
20.7 |
15.9 |
| Pyrene | 25 |
18 |
30 |
48 |
46 |
33 |
40.4 |
11.7 |
36.2 |
29 |
14.7 |
28 |
17 |
| Total PAHs | 515 |
601 |
520 |
898 |
709 |
689 |
579 |
421 |
1,126 |
461 |
646 |
480 |
591 |
| Total Carcinogenic PAHs | 279 |
422 |
282 |
445 |
421 |
402 |
309 |
196 |
681 |
247 |
487 |
281 |
407 |
| Benzo(a)pyrene Equivalent | 123 |
144 |
133 |
146 |
140 |
211 |
112 |
74 |
224 |
84 |
185 |
249 |
156 |
cCarcinogenic PAHs.
*Sum of b and k isomers reported.
ND - Not detected. Value in parentheses is the reported detection limit. For
calculation of averages and totals, ½ the detection limit was used for
values that were not detected.
Table 7. Summary of PAH Treatment Performance Data [2]
Constituent |
Cleanup Goal (mg/kg) |
Average Concentration at Outset of Treatment*** (mg/kg) |
Average Concentration After Treatment*** (mg/kg) |
Treatment Efficiency (%) |
|---|---|---|---|---|
| Two Ring PAHs Naphthalene |
|
|
|
|
| Three Ring PAHs Acenaphthene Acenaphthylene Anthracene Fluorene Phenanthrene |
|
|
|
|
| Four Ring PAHs Benzo(a)anthracene* Chrysene* Fluoranthene Pyrene |
|
|
|
|
| Five and Six Ring PAHs Benzo(b)fluoranthene* Benzo(k)fluoranthene* Benzo(ghi)perylene Benzo(a)pyrene* Dibenzo(ah)anthracene* Indeno(1,2,3-cd)pyrene* |
|
|
|
|
| Total PAHs | 950 |
8,621 |
655 |
92 |
| Carcinogenic PAHs | N/A |
1,095 |
376 |
66 |
| Benzo(a)pyrene Equivalent | 180 |
433 |
150 |
65 |
*Carcinogenic PAHs.
**Combined with benzo(b)fluoranthene.
***Concentration values are averages from first six batches shown on Tables 5
and 6, and are reported as mg/kg dry weight.
N/A - Not applicable. No cleanup goal established for this constituent/group of
constituents.
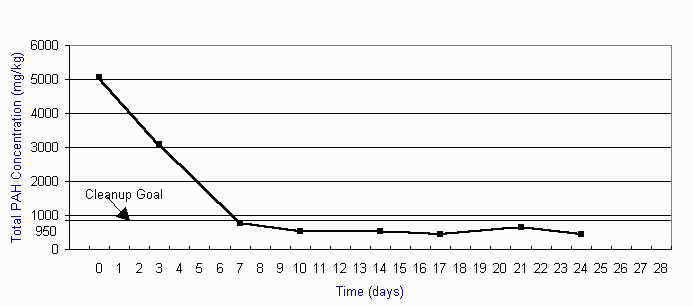
Figure 3. Total PAH Concentration vs. Time Bioreactor/Batch R1 B5 [2]
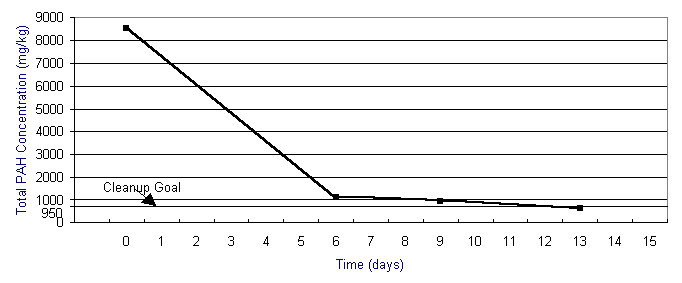
Figure 4. PAH Concentration vs. Time Bioreactor/Batch R1 B8 [2]
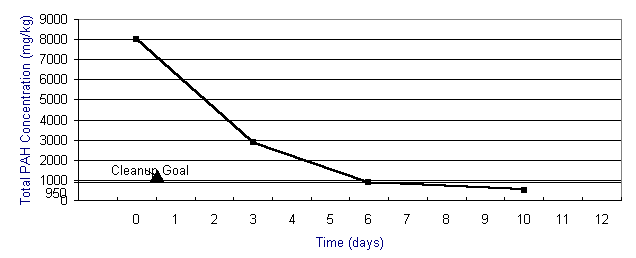
Figure 5. PAH Concentration vs. Time Bioreactor/Batch R1 B9 [2]
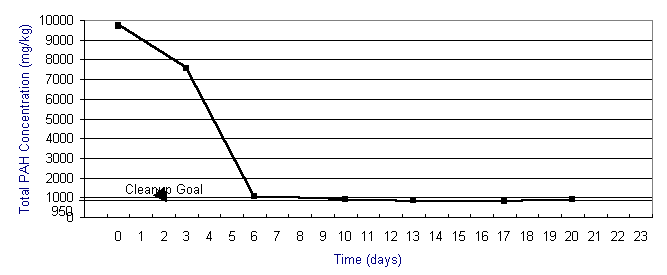
Figure 6. PAH Concentration vs. Time Bioreactor/Batch R1 B10 [2]
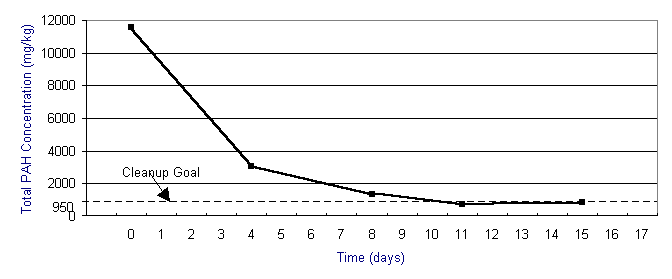
Figure 7. PAH Concentrations vs. Time Bioreactor/Batch R2 B9 [2]
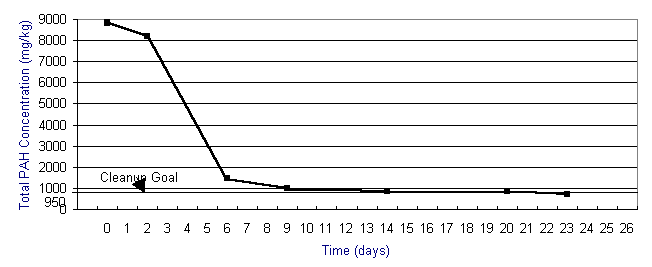
Figure 8. PAH Concentrations vs. Time Bioreactor/Batch R2 B10 [2]
Nine of the 13 batches met the cleanup goal of 180 mg/kg for B(a)P-equivalent; the batches that met the cleanup goal ranged from 24 to 156 mg/kg. According to the OSC, further treatment was also performed on the four batches that did not appear to meet the cleanup goal for B(a)P (R2 B20 at 211 mg/kg; R1 B7 at 224 mg/kg; R2 B6 at 185 mg/kg; and R2 B7 at 249 mg/kg). However, additional data on treatment performance for these batches are not provided in the available references. [26]
As shown in Figures 3 through 8, the majority of the biodegradation occurred during the first 5 to 10 days of treatment, and the cleanup goal for total PAHs was met for 12 of the 13 batches within approximately 19 days of treatment.
The data in Table 7 show that the number of ring structures in the PAH constituent (two, three, four, or five and six rings) affected the treatment efficiency. The concentrations of constituents with two to four rings were reduced 71% to 99%, while five and six ring constituents were reduced 19% to 81%. These results are consistent with reports in the technical literature that show that higher molecular weight PAHs (e.g., five and six ring structures) are more difficult to biodegrade than two to four ring structures. [8]
Analytical data for 16 PAHs are available for 13 of the 61 batches processed through the treatment system during the course of remediation. Data are available for specific days during each batch treatment, as well as for the range of operating conditions over the course of the treatment application.
Limited information is contained in the available references on performance data quality. A quality assurance program plan (QAPP) for this application was developed by a commercial analytical laboratory (Analytical Services Corp.). The QAPP addressed project organization and responsibilities, QA objectives, sampling procedures, sample custody, analytical procedures, and other items.
PAH slurry samples were centrifuged and extracted following SW846 Method 3540. PAH concentrations were quantified using gas chromatography with a mass spectrometer detector following SW846 Method 8270. As shown in Appendix A, detection limits for individual PAHs ranged from 5 mg/kg to 223 mg/kg for the first six batches shown in Table 5 for this application.
The vendor noted two problems related to performance data quality for this application. Problems were noted concerning implementation of the sampling plan, and for sample extraction and quantification. These problems were resolved by developing an approved sampling plan, and by performing audits on the extraction and analytical methodology.
According to the OSC, the vendor evaluated two potential methods for PAH sample extraction (soxhlet and sonic extraction) and found “significant differences” in analytical results based on method used. Based on these results, the analytical method was standardized and written into the contract. [26]
Back to Treatment System Description | Table of Contents | Forward to Treatment System Cost
The contract for remediation services at Southeastern Wood was competitively procured by EPA. For this procurement, EPA's Contracting Officer (CO) obtained a deviation from the EPA Acquisition Regulations which allowed a negotiated procurement without submission of technical proposals. Performance specifications were used instead of specifying a technology. Twelve bidders submitted proposals for different technologies and price was the determining factor for award. The contract was awarded to OHM Remediation Services Corporation. EPA required the vendor to perform a technology demonstration at the site to ensure that the technology would be feasible. The contract with OHM was a firm fixed price (lump sum) service contract. Additional information on the procurement process for this application is provided in Reference 4. [4]
Tables 8 and 9 present the costs for the slurry phase bioremediation treatment application at Southeastern Wood. In order to standardize reporting of costs across projects, costs are shown in Tables 8 and 9 according to the format for an interagency Work Breakdown Structure (WBS). The WBS specifies 9 before-treatment cost elements, 5 after-treatment cost elements, and 12 cost elements that provide a detailed breakdown of costs directly associated with treatment. Tables 8 and 9 present the cost elements exactly as they appear in the WBS, along with the specific activities as provided by the treatment vendor.
As shown in Table 8, the vendor provided actual cost data that shows a total of $2,400,000 for activities directly associated with treatment of 14,140 tons (10,500 cubic yards) of soil and sludge (i.e., excluding after-treatment cost elements). This total consists of costs for mobilization/setup, startup/testing/permits, and operation. Included in this total are costs for treatment of 61 batches at $18,700 per batch. The total costs for activities directly attributed to treatment corresponds to $170 per ton ($230 per cubic yard) of soil and sludge treated. In addition, the vendor provided cost data that show a total of $500,000 for after-treatment activities (site preparation and closure). The vendor provided no information on before-treatment activities, such as for monitoring, sampling, testing, and analysis in this application. [3, 19]
Table 10 shows actual costs provided by the vendor for slurry preparation, slurry phase biological treatment, and dewatering on a per ton of material basis. This table shows that the relatively largest costs associated with this system are for the slurry preparation process. [1]
Table 8. Treatment Activity Cost Elements According to the WBS* [3]
Cost Elements(Directly Associated With Treatment) |
Cost ($) |
Actual or Estimated |
|---|---|---|
| Mobilization/Set Up (Design Engineering) | 100,000 |
A |
| Startup/Testing/Permits (Treatability and Pilot-Scale Testing) | 200,000 |
A |
| Operation (short-term - up to 3 years) (soil screening and slurry preparation, slurry treatment, slurry dewatering, and project administration and support) | 2,100,000 |
A |
| TOTAL TREATMENT ACTIVITY COST | 2,400,000 |
A |
Table 9. After-Treatment Cost Elements According to the WBS* [3]
Cost Elements |
Cost ($) | Actual or
Estimated (A) or (E) |
|---|---|---|
| Site Restoration (site preparation and closure) | 500,000 |
A |
| TOTAL AFTER-TREATMENT COST | 500,000 |
A |
Table 10. Unit Costs for Treatment of Soil and Sludge at Southeastern Wood Preserving Superfund Site [1]
Process |
Cost per Dry Ton of Material Treated ($) | Actual or
Estimated (A) or (E) |
|---|---|---|
| Slurry Preparation | 50 - 60 |
A |
| Slurry Phase Biological Treatment | 40 - 55 |
A |
| Dewatering Process | 20 - 30 |
A |
| Total for Slurry Phase Biological Treatment System | 110 - 145 |
A |
*Cost figures rounded up to the nearest $100,000.
The cost data presented above are actual costs for this application as reported by the treatment vendor, and are believed to accurately represent the costs associated with this application.
The vendor specified three variables that have a significant impact on the cost of remediation using this technology: the slurry phase reactor solids concentration, residence time in the reactors, and the percentage of material removed in the slurry preparation/soil washing process. According to the vendor, increasing the solids concentration in the reactors increases the amount of soil treated per batch. This results in a decrease both in the total number of batches treated and the cost per ton of treatment. In addition, longer batch residence times reduce the system throughput and, therefore, increase the cost of treatment. The higher the percentage of material that is removed by the slurry preparation/soil washing process, the lower the cost for the bioreactors, since less material will remain to be biologically treated. [3]
Back to Treatment System Performance | Table of Contents | Forward to Observations and Lessons Learned
Back to Treatment System Cost | Table of Contents | Forward to References
This case study was prepared for the U.S. Environmental Protection Agency’s Office of Solid Waste and Emergency Response, Technology Innovation Office. Assistance was provided by Radian International under EPA Contract No. 68-W3-0001 and U.S. Army Corps of Engineers Contract No. DACA45-96-D-0016.
Back to Observations and Lessons Learned | Table of Contents