![]() A newsletter about soil, sediment, and groundwater characterization and remediation technologies
A newsletter about soil, sediment, and groundwater characterization and remediation technologies
This issue of Technology News and Trends highlights recent applications of Triad, an integrated site characterization and cleanup strategy that limits decision uncertainty and reduces project duration and cost. In contrast to using one-time, exclusive steps typical of a linear strategy, Triad approaches conceptual site model development, planning, data review, characterization, and remedy implementation as real-time, evolving, iterative procedures. Applications described in this issue illustrate how direct sensing tools, field-based analytical methods, innovative sampling design, and data visualization and communication provide high-density, defensible datasets within a range of regulatory frameworks.
Triad Use at Naval Base San Diego Saves an Estimated Six Years and $3 Million for Site Investigation
Online Resources
The Triad Resource Center offers technical tools and documents on systematic planning, dynamic work strategies, sample acquisition and handling, measurement and data management, and regulatory acceptance for Triad applications (https://triadcentral.clu-in.org/). This web site also provides project profiles highlighting cost and time savings at specific sites.
The U.S. Naval Facilities Engineering Command Southwest (NAVFAC SW) used the Triad approach to collect an integrated hydrogeologic and chemical dataset for expediting and optimizing characterization of a volatile organic compound (VOC) plume at Naval Base San Diego (NBSD), CA. The 295-acre "IR Site 22" was identified in 2003 when VOC concentrations reaching 100 mg/L were reported in an upgradient well as part of a remedial investigation at "NBSD IR Site 4." As a result, NAVFAC SW initiated investigative actions to identify potential sources of VOC contamination in ground water, determine whether the source(s) were caused by Navy activities, and delineate VOCs in ground water.
IR Site 22 is located approximately three miles southeast of downtown San Diego, on the east side of San Diego Bay. The site comprises reclaimed tidal lands covered by dredged material, and encompasses privately owned commercial and industrial properties in addition to the NBSD.
IR Site 22 investigations leveraged all three elements of Triad:
- The stakeholder team initiated a systematic planning process early in the project; stakeholders included NAVFAC SW, the Space and Naval Warfare Systems Center (SPAWAR), the California Regional Water Quality Control Board, and the California Department of Toxic Substances Control. The team collaborated in developing data quality objectives (DQOs) and the conceptual site model (CSM), which was used to design a technical approach. Regulators visited the site several times during field work to participate in data interpretation and decisions to "step out" sampling to additional locations.
- Field staff collected real-time in situ measurements using a site characterization and penetrometer system (SCAPS) truck equipped with onboard cone penetrometer testing and a membrane interface probe (CPT/MIP) and a direct sampling ion trap mass spectrometer (DSITMS).
- Stakeholders collaborated in developing a dynamic work strategy to allow the field team to step out dynamically to meet project-specific DQOs. Web-based, near-real time communication of project data allowed stakeholders to view daily reports and remain engaged in the project as the CSM evolved.
The field work was conducted in three phases. Between each phase, a systematic planning meeting was held to present current data and the updated CSM and to optimize the following work phase.
Phase I involved a two-week lithologic and dense non-aqueous phase liquid (DNAPL) investigation using CPT with MIP and DITMS to build a detailed lithologic site model and identify VOC source area(s). A total of 35 borings were advanced to depths reaching 58 feet below ground surface (bgs). Lithologic data from CPT were used to augment existing information and expand the CSM. Results indicated three potential VOC source areas.
Phase II comprised a four-week, site-wide investigation of ground water. Using Phase I CPT and MIP data to optimize locations and screened intervals, a total of 24 direct-push temporary ground-water wells were installed to depths of up to 40 feet bgs. Each temporary well was constructed using nominal ¾-inch PVC casing with a 10-foot screened interval. Ground-water samples were collected for 24-hour-turnaround VOC analysis by a fixed-base laboratory using U.S. EPA Method 8260B. Eleven of the wells were surveyed to determine hydraulic gradient across the site.
Following evaluation of Phase I and II results, Phase III was initiated to address data gaps regarding the extent of dissolved VOC plumes, include potential preferential pathways in the refined CSM, and assess continuity between identified VOC source areas and VOCs independently identified in IR Site 4 ground water. This eight-week phase involved collecting lithologic data from 16 CPT borings, installing 22 additional temporary wells, and collecting ground-water samples for laboratory analysis of VOCs.
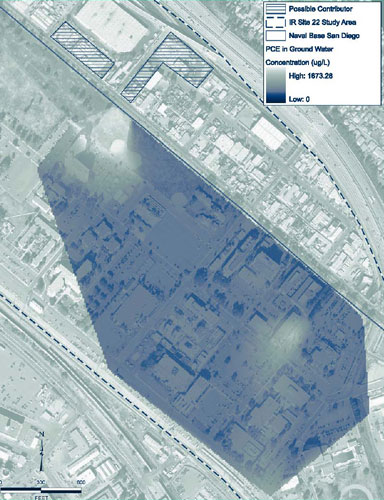
The collaborative data revealed two VOC plumes including tetrachloroethene (PCE) originating from offsite sources on private properties (Figure 1). Results also suggested contaminant migration favoring a subsurface paleochannel preferential pathway. In total, the SCAPS project team collected 2,775 vertical feet of lithologic data and 790 linear feet of VOC concentration data representative of the 295-acre site. The collaborative dataset included analytical results from 49 ground-water samples.
Triad implementation provided an expedited high-density dataset and a refined CSM in near-real time, resulting in cost avoidance estimated at $3 million and schedule savings of approximately six years. The Navy continues to work with regulatory stakeholders in developing a remedial strategy for IR Site 22.
Contributed by Jim Leather, Ph.D. SPAWAR System Center (jim.leather@navy.mil or 619 -553-6240) and Karen Collins, Richard Brady & Associates (kcollins@rbrady.net or 858-634-4516)
Single Field Mobilization Completes Site Investigation and Removal Actions
The Kentucky Research Consortium for Energy and the Environment (KRCEE) worked with the U.S. Department of Energy (DOE) last summer to introduce new approaches and technologies to the site cleanup program operating at the Paducah Gaseous Diffusion Plant (PGDP) in western Kentucky. A Triad demonstration was conducted at PGDP's Area of Concern (AOC) 492 that integrated several real-time characterization tools into dynamic work strategies (DWSs) for expediting characterization and remediation within one field deployment. Field work focused on methods to address uranium and polychlorinated biphenyls (PCBs), two of the most common soil and sediment contaminants at PGDP. Those methods included laser-based gamma "walkover" surveys (GWS), x-ray fluorescence (XRF), in situ gamma spectroscopy (ISGS), PCB immunoassay kits, multi-increment sampling (MIS), and adaptive compositing (AC).
The PGDP has operated for more than 50 years and is now the only active uranium enrichment facility in the United States. Past operations released contaminants to ditches that emptied into neighboring streams, contaminating sediments. Maintenance activities within the streams and ditches resulted in contaminated sediments being placed on streams banks and adjacent upland areas including AOC 492. Limited historical information (three surface samples) identified uranium and PCB concentrations of 1,150 and 44 ppm, respectively, in AOC 492 surface soil.
In the fall of 2007, a group of technical representatives from EPA Region 4, the Commonwealth of Kentucky, DOE, KRCEE, and Argonne National Laboratory (ANL) collaborated in a systematic planning session to devise the initial CSM and form the project's DWSs. The session yielded default risk-based, wide-area averaged and hot spot project criteria of 11 and 99 ppm, respectively, for uranium and 3.6 and 33 ppm for PCBs. It also identified three exposure units—based on a teenage recreational user exposure scenario—within AOC 492. Based on an understanding of uranium processing and past experience, PCBs were expected to be collocated with uranium contamination. The field strategy included three activities deployed in one field effort: characterizing the level and extent of soil contamination, excavating soil with concentrations exceeding project criteria, and demonstrating post-excavation that project criteria were attained for each of the exposure units.
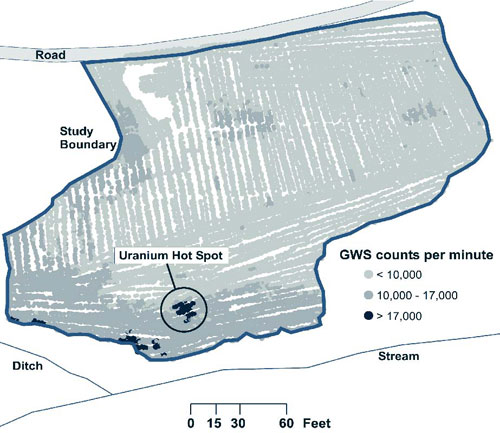
The laser-based GWS for determining the presence of elevated gamma radiation in near-surface soil was the first tool to be deployed. Approximately 24,000 GWS data points were collected over the course of three days, providing spatially dense information (an average of four measurements per square meter) about the location of uranium contamination in near-surface soil. Based on the GWS data, twenty locations were further sampled and analyzed by XRF and ISGS. The selected locations spanned the range of GWS results; the XRF/ISGS data were used to develop a relationship between GWS results and surface soil uranium concentrations. Once that relationship was established, uranium hot spots could be identified based on GWS data (Figure 2), and the layout of exposure units modified to reflect the spatial distribution of contamination. Approximately 13 m³ of soil were subsequently removed from the uranium hot spots and placed in an offsite disposal facility. GWS and in situ XRF readings verified that the excavation surface complied with the project hot spot criteria.
MIS and AC sampling techniques were used jointly with the PCB immunoassay kits to verify that PCB hot spots did not exist for the two exposure units considered most likely impacted by contamination. MIS uses soil collected from multiple locations spread systematically across a decision unit to form a sample that is more representative of the average conditions across an area than any one individual sample location would be. AC combines samples from adjacent decision units into composites before analysis; during the compositing process, the contributing samples are split, with one half of the splits archived for possible later analysis and the other half used to make the composites. Field investigation levels are defined as a function of the number of samples contributing to the composite and the original project criteria. If the analytical results of a composite exceed the field investigation level, each of the archived sample splits contributing to the composite is analyzed. Use of MIS and AC minimized the number of sample analyses needed; only 23 were necessary to verify compliance with hot spot and area-averaged cleanup criteria for the entire study area. More than 300 analyses would have been required if each of the soil increments had been analyzed individually.
Rigorous data quality control (e.g., use of calibration standards and control charts) was developed and implemented for the project to ensure technically defensible datasets were obtained from field analytics. Data quality for the XRF uranium measurements was comparable to standard laboratory alpha spectroscopy data quality, with a correlation coefficient of 0.99 and detection limits at background levels. Each sample analyzed by immunoassay also was analyzed at an offsite laboratory for confirmation. In general, the PCB immunoassay kits compared favorably with laboratory total PCB data, with a correlation coefficient greater than 0.9.
The field work generated more than 20,000 individual GWS data points, several hundred XRF measurements, and almost 400 surface soil increments. Characterization of AOC 492, contaminated soil removal, and verification that project criteria had been achieved were completed in just 10 days of field work. The use of MIS and AC significantly reduced the number of soil samples requiring analysis, while the use of field analytics reduced the cost of each sample analysis. The availability of real-time data (e.g., XRF, ISGS, GWS, and PCB immunoassay kit results) allowed a seamless integration of characterization, remediation, and verification sampling. Demonstration results indicated that use of Triad and a suite of investigative tools effectively characterized the soil, identified locations requiring remediation, guided soil removal, and verified that cleanup criteria were achieved.
Contributed by Rich Bonczek, DOE-Portsmouth/Paducah Project Office (Rich.Bonczek@lex.doe.gov or 859-219-4051), Steve Hampson, KRCEE (skhampson@alltel.net or 502-564-8390), and Robert Johnson, ANL (rljohnson@anl.gov or 630-252-7004)
Triad Expedites Brownfields Redevelopment in Fairbanks
The Fairbanks North Star Borough (FNSB) used Triad in 2006-2007 to assess environmental conditions at a municipal property along the Chena River in Fairbanks, AK. FNSB accelerated the site investigation as part of a brownfields assessment grant received from the U.S. EPA in 2005. Low-level contamination had been identified onsite in past investigations, but its extent and impact on future redevelopment had not been evaluated. FNSB anticipates integrating the property into a 101-acre "Chena Riverbend" multi-use project.
The 22-acre area of concern encompasses the "Old City Landfill," an auto impoundment where petroleum and metal contaminants may have been released, and a municipal snow piling area potentially contributing polycyclic aromatic hydrocarbons (PAHs), total petroleum hydrocarbons, and metals from melt water. From 1951 until 1965, the unregulated landfill was used for municipal debris potentially containing multiple contaminants of concern (COCs). The site subsequently was covered with 5-20 feet of clean fill and developed for recreational use.
The underlying soil consists of alluvial sand and gravel deposits with interbedded silty overbank deposits up to 500 feet thick. Ground water is shallow (8-15 feet bgs) and generally flows toward the adjacent river. Limited Phase I investigations in 2005 focused on ground-water and soil conditions in and below the landfill. Results indicated PCB and lead concentrations in soil within the landfill exceeding regulatory criteria, as well as slightly elevated manganese and thallium concentrations in ground water.
The Alaska Department of Environmental Conservation (ADEC), U.S. EPA Office of Superfund Remediation and Technology Innovation, and U.S. Army Corps of Engineers-Seattle District assisted FNSB in Triad planning and implementation, including establishing and refining the CSM. Key issues concerning site development on the landfill included gas emissions, potential leachate, and the vertical and horizontal extent of debris. A high-level decision flowchart was developed to correlate release/risk identification to site redevelopment strategies.
Investigation activities included geophysical surveys, in situ soil-gas monitoring, test pit excavation and soil sampling, monitoring well installation, and ground water sampling. A detailed flowchart was established to allow CSM updates in the field and provide criteria for decisions such as sampling locations. For example, preliminary soil-gas sampling plans were designed on standard 300-foot grids in accordance with EPA guidance for investigating landfills (EPA600-R-05-123). Field decisions allowed for adding sampling locations within and outside the original grids and included triggers for additional sampling supporting future modeling of vapor pathways. (Initial ambient air monitoring activity was cancelled due to ground cover by snow and consequent reduction in fugitive gas emissions.)
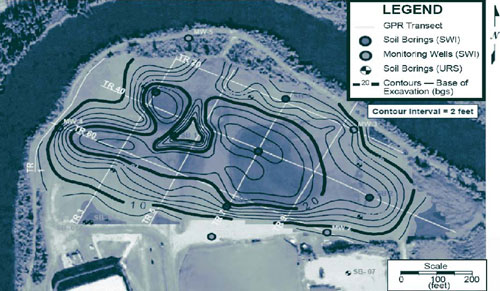
To maximize application of Triad in a real-time environment, FNSB’s contract mechanism reflected flowchart options on a unit cost basis to allow for maximum flexibility during field work. Field investigations began in October 2007 with mobilization of drill rigs, excavators, and a field laboratory. Work started with a one-week geophysical survey using ground penetrating radar to confirm the landfill’s areal extent (as determined in Phase I investigation) and determine the landfill depth. Survey results confirmed that the landfill was confined to the western part of the site (Figure 3) with soil fill and debris extending 25 feet bgs.
This information was used in real time to adjust sampling locations for soil-gas and ground-water sampling. Soil probes were advanced above the landfill to depths of 7-8 feet, and one soil-gas sample was extracted from each probe. Hand-held flame ionization detectors (FIDs) and photoionization detectors (PIDs) were used to field screen each sample. Those showing hits were analyzed for VOCs using a portable gas chromatograph (GC) housed in a nearby trailer. Due to slow throughput of the field GC, some samples were submitted to a fixed laboratory for VOC analysis; samples were selected from locations of low or non-detect PID readings across the landfill footprint. Over one week, 94 soil gas samples were collected, 41 samples were analyzed with an onsite GC, and 6 samples were submitted to the offsite laboratory.
Results from the PID screening of soil gas predicted higher and more extensive VOC concentrations than the other methods. PID readings indicated concentrations of 0-165 parts per million by volume (ppmv), while field GC and fixed laboratory results indicated only two detections, which were below 1 ppmv. This difference suggested presence of volatile compounds with ionization potentials less than 10.6 EV, which were not included in other analyses.
The six fixed-laboratory results indicated that field screening results may not have quantified soil-gas concentrations. Fixed laboratory results indicated presence of benzene and PCE above ADEC draft screening levels of 3.1 and 8.1 µg/m³, respectively. Other compounds such as trichloroethene and carbon tetrachloride also exceeded screening levels in at least one location. PID measurements were not detected for three of the samples at these locations due to detection limits higher than the fixed laboratory's. Laboratory results also did not agree with field GC data showing non-detects (with the exception of one sample) and generally indicated interference from non-target hydrocarbons. Although the methods did not agree with respect to concentrations, all three methods indicated VOC presence above screening levels throughout the landfill. This information was deemed sufficient for planning purposes.
Traditional, non-Triad methods were used to initially investigate the auto impound and snow piling areas. Six test pits were excavated and soil sample results indicated that concentrations of metals and PAHs in the two areas did not exceed regulatory criteria, and additional planned sampling using Triad methods was unnecessary.
The geophysical survey and soil-gas sampling results were used to select five monitoring well locations on the landfill perimeter for evaluation of flow direction and potential release of leachate into the river. The wells were installed with 5-foot screens set at depths to encompass historical high and low ground-water levels. Only arsenic was detected at concentrations exceeding state regulatory criteria for ground water in one (downgradient) well, where concentrations reached 55.2 µg/L (above the 50 µg/L ADEC action level). Remaining COCs were either below state criteria or not detected in any of the monitoring wells.
Results indicating VOC and methane presence prompted collection of soil and grain-size samples for future air modeling. Soil-gas FID and PID data indicated landfill methane concentrations of 0-8,600 ppmv, while field GC analysis found concentrations reaching 20,700 ppmv. Findings suggest future onsite activities need to account for potential methane concentrations above the lower explosive limit (50,000 ppmv).
Project results indicated that FNSB could:
- Develop the auto impound and snow piling areas without restrictions, and
- Employ soil-gas management strategies such as subslab venting to prevent vapor intrusion into onsite buildings.
The entire sampling program was conducted in a single mobilization over two months at a cost of approximately $200,000, in contrast to a traditional site investigation estimated at $300,000 over five months.
Contributed by Tami Sheehan, FNSB, (tsheehan@co.fairbanks.ak.us or 907-459-1240) and Kym Takasaki, U.S. Army Corps of Engineers-Seattle District (kymberly.c.takasaki@usace.army.mil or 206-764-3322)
