![]() A newsletter about soil, sediment, and groundwater characterization and remediation technologies
A newsletter about soil, sediment, and groundwater characterization and remediation technologies
- CSIA at the Bandera Road Site Reveals a Second Contaminant Source
- Combined Dual Isotope and Dissolved Gas Analyses Used to Evaluate Nitrate Contamination at LLNL Site 300
- CSIA Discounts PCE Biodegradation as Source of TCE in Municipal Wellfield
- Upcoming Green Remediation Conference
- Strategy for Characterizing DNAPL
This issue of Technology News and Trends highlights the use of compound specific isotope analysis (CSIA), an environmental forensics technique used to characterize contaminated sites and the progress of bioremediation and natural attenuation. CSIA measures and compares the ratios of stable isotopes found in compounds of suspected contaminant sources or plumes as well as the feedstock or manufacturing process of materials historically used in a site's vicinity. Isotopic analysis can help discern the potential for multiple spills of the same compound based on their different isotopic "signatures." An isotopic signature can be used to associate a contaminant plume with a particular spill or potentially responsible party. It also can be used to evaluate the extent of contaminant degradation caused by microbes during natural attenuation.
CSIA at the Bandera Road Site Reveals a Second Contaminant Source
CLU-IN Resources
EPA's CLU-IN Web host provides information on methods and standard operating procedures for site characterization, such as A Guide for Assessing Biodegradation and Source Identification of Organic Groundwater Contaminants Using Compound Specific Isotope Analysis (CSIA) (EPA 600/R-08/148), at: www.cluin.org/characterization/. CLU-IN information on the related issue of natural attenuation is available in guidance such as Monitored Natural Attenuation of Inorganic Contaminants in Ground Water (Volumes 1 and 2, EPA 600-R-07-139 and EPA 600-R-07-140), at: www.cluin.org/remediation/.
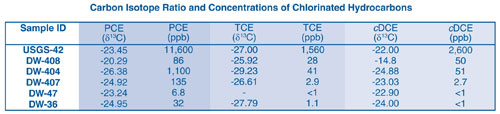
The U.S. Environmental Protection Agency (EPA) Region 6 office recently conducted a CSIA investigation at the Bandera Road Groundwater Plume Superfund site in Leon Valley, TX, just outside San Antonio. Previous groundwater investigations identified chlorinated solvents exceeding groundwater standards. Determining the carbon isotope ratios (13C/12C) for tetrachloroethene (PCE), trichloroethene (TCE), and cis-1,2-dichloroethene (cDCE) in groundwater samples helped to distinguish release sources and assess biodegradation. Gas chromatography-isotope ratio mass spectrometry (GC-IRMS) and sample preparation techniques that could detect chlorinated solvents at concentrations as low as 20 ppb were used.
Many processes affecting contaminants in groundwater, such as dilution, sorption, and volatilization, have little or no effect on isotopic ratios. Processes such as biodegradation and abiotic degradation, however, are associated with significant isotopic fractionation. In addition, the isotopic ratios of PCE and TCE vary depending on the manufacturer. As a result, CSIA can be used at a contaminated site to identify sources of chlorinated solvent; help determine the sequence of multiple releases; and identify, characterize, and quantify biotic and abiotic transformation reactions.
The study area encompassed approximately 162 acres in a commercial area with nearby residences. Potential contaminant sources included several dry cleaners, automotive businesses, and a former municipal airfield. The primary contaminants of concern are PCE, TCE, and cDCE due to their detection frequency and concentrations in local groundwater. Of the 10 wells with PCE or TCE concentrations exceeding the 5 ppb federal drinking water standard, four had been plugged and abandoned prior to CSIA work because they were open to the Edwards Aquifer, the sole-source drinking water aquifer for the San Antonio area.
The other six impacted wells extend to water-bearing formations (Austin Chalk and Buda Limestone) above the Edwards Aquifer. The highest PCE concentration of 11,600 ppb was detected in an Austin Chalk monitoring well (USGS-42) adjacent to a former dry cleaning facility. Another Austin Chalk well (DW-404) approximately 150 feet from an operating dry cleaning facility exhibited PCE concentrations as high as 1,100 ppb.
CSIA was conducted in June 2009, in accordance with EPA's Guide for Assessing Biodegradation and Source Identification of Organic Groundwater Contaminants Using CSIA. The guidance allows for a typical analytical uncertainty of ±0.5‰ for carbon isotopes. Results of the analysis are reported as δ13C, which represents a comparison between the ratio of 13C to 12C in a sample and the ratio in an international standard, expressed in parts per thousand (‰). A δ13C of -30‰, for example, indicates that the ratio of 13C to 12C for the sample is 3% lower than the standard. Biodegradation induces a shift of the residual compound to less negative values of δ13C; the more negative the CSIA values are, the closer to the source and/or the more recent the contaminant release is likely to be.
Techniques for collecting and preserving groundwater samples for CSIA are identical to those used in collecting samples for volatile organic analysis using EPA Method 8260. All samples are packed in the same manner and then shipped to an offsite laboratory. For Bandera Road CSIA, laboratory costs averaged $600 per sample.
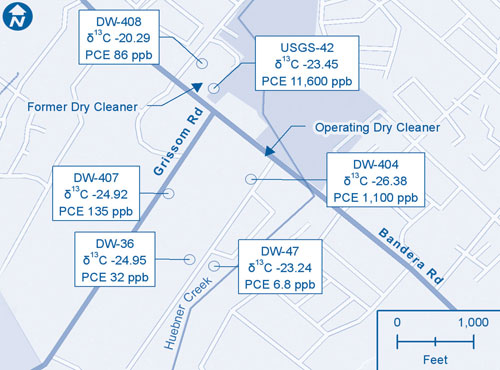
Comparison of carbon isotope ratios for PCE indicates that monitoring well USGS-42 contains the highest PCE concentration, but well DW-404 has a more negative δ13C value (Table 1). This indicates that either a more recent release has taken place near DW-404 and/or less degradation is occurring near this well. Subsequent passive soil gas sampling at the operating dry cleaner near DW-404 identified PCE, TCE, cDCE, and vinyl chloride contamination in soil gas.
The spatial distribution of δ13C for PCE and its degradation products (TCE and cDCE) and standard sampling results were examined to determine potential trends in biodegradation (Figure 1). Biodegradation impacts also were observed in well DW-408, which is located approximately 400 feet from the former dry cleaner and monitoring well USGS-42. CSIA data and contaminant ratios indicate that contamination in other wells (DW-407 and DW-36) may originate from a source other than than the former dry cleaner.
Using the CSIA results, Region 6 plans to conduct a tracer study to help identify contaminant migration pathways. Analysis of additional CSIA techniques involving chlorine and hydrogen istopes (39Cl/37Cl and 2H/1H) may be used to further distinguish and delineate the plumes.
Contributed by Chris Villarreal, EPA Region 6 (villarreal.chris@epa.gov or 214-665-6758) and Yi Wang, Ph.D., DPRA-ZymaX Forensics (yi.wang@zymaxusa.com or 760-781-3338)
Combined Dual Isotope and Dissolved Gas Analyses Used to Evaluate Nitrate Contamination at LLNL Site 300
Lawrence Livermore National Laboratory (LLNL) developed an integrated approach using groundwater nitrate (NO3) isotopic composition and dissolved gas analyses to help identify nitrate sources and demonstrate natural attenuation at the LLNL Site 300 Superfund site, east of San Francisco Bay, CA. The U.S. Department of Energy has conducted high explosives (HE) formulation and testing at Site 300 since 1955. In the 1990s, site investigations identified nitrate in groundwater at concentrations reaching 90 mg/L (as NO3), significantly higher than the average 30 mg/L background level at Site 300. As a result, the HE process area was studied to determine whether elevated groundwater nitrate was due to degradation of past releases of HE to unlined rinse-water lagoons and landfills, effluent from site septic discharge systems, or natural nitrate from soil and bedrock. The extent to which nitrate was being attenuated once it entered underlying groundwater also was evaluated.
Fifty stable-isotope and dissolved-gas analyses were performed on groundwater samples collected from depths of 100 to 170 feet below ground surface (bgs) in an underlying bedrock aquifer. Stable isotope ratios of nitrogen and oxygen were measured in groundwater nitrate and in potential source materials, including barium nitrate (a mock explosive), RDX (a high explosive formulated and tested at Site 300), and nitric acid (which may have been present in waste disposed in the onsite landfills). Use of both nitrate-N and nitrate-O isotopic composition (the dual isotope approach) allowed greater differentiation among nitrate sources than analysis of nitrate-N isotopic composition alone. The approach also provided evidence of denitrification, the dominant subsurface degradation process for nitrate. Biologically mediated denitrification typically favors lighter isotopes, systematically shifting the isotopic composition of both nitrogen and oxygen in residual nitrate along a characteristic trend line.
The approach used to determine nitrate isotopic composition relied on a specific strain of denitrifying bacteria. The denitrifier approach can be two to three orders of magnitude more sensitive, less subject to contaminated groundwater matrix interferences such as sulfate, and less labor-intensive than other methods for isotope composition analysis. The technique also allowed collection of sample volumes as small as 40 mL and determination of nitrate isotopic composition in low-nitrate groundwater, where denitrification effects on isotopic composition are most pronounced.
Dissolved gases were measured in the same set of samples to more conclusively assess the role of saturated-zone denitrification in attenuating nitrate transport. Analyses showed excess concentrations of dissolved gases resulting from atmospheric gases, which were determined by argon measurement. LLNL constructed a simple, portable, gas analyzer to determine the dissolved nitrogen, argon, and oxygen gas concentrations in groundwater samples in the field. Costs for combined isotope and dissolved gas analysis averaged approximately $600 per sample.
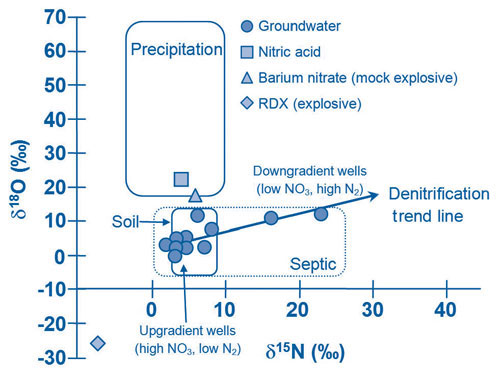
Dissolved nitrate isotopic compositions in the samples were consistent with a natural source (non-impacted soil and bedrock) or a septic effluent source. In addition, groundwater isotopic signatures differed markedly from isotopic signatures of materials used in onsite HE operations, including nitric acid, barium nitrate, and degraded RDX. Although the HE materials dataset is too small to be definitive, it supports determination of a non-HE source for site nitrate contamination.
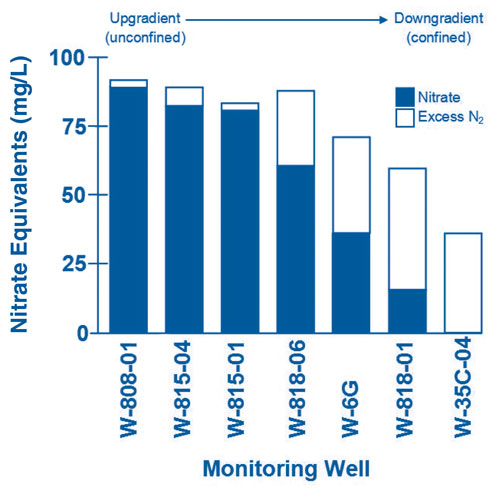
Groundwater sampled in the upgradient unconfined aquifer had high concentrations of nitrate and oxygen and no excess nitrogen. In the downgradient confined aquifer, concentrations of dissolved oxygen and nitrate decrease and excess nitrogen increases, a pattern consistent with saturated-zone denitrification (Figure 2). The isotopic composition of both nitrogen and oxygen in groundwater nitrate shifts to heavier values in the downgradient aquifer. On a nitrate isotopic composition plot, 15N and 18O are positively correlated with a linear regression slope of 0.5 that is characteristic of denitrification (Figure 3).
The combined stable isotope and dissolved-gas analyses provided evidence of saturated-zone denitrification by way of microbial degradation, rather than dispersion and dilution, as the primary attenuation mechanism for low nitrate concentrations in downgradient groundwater. As a result, monitored natural attenuation (MNA) was selected as a remedy for nitrate in this area. More information about the use of this approach is available in EPA guidance, Monitored Natural Attenuation of Inorganic Contaminants in Ground Water, Volume 2.
The U.S. Air Force Center for Engineering and the Environment (AFCEE) has begun using dual-isotope and dissolved gas analyses at several bases, including Edwards Air Force Base (AFB), CA, and Kirtland AFB, NM. At Edwards AFB, this technique will be used to evaluate potential sources including naturally occurring nitrate, explosive ordnance disposal, septic waste, and hydrazine (a nitrate-containing component of rocket fuel) and to assess possibility of implementing an MNA remedy.
Contributed by Bradley Esser, Ph.D., LLNL (bkesser@llnl.gov or 925-422-5247), Edward Brown, AFCEE (edward.brown.3@us.af.mil or 210-536-5239), and Robert Ferry, Brown and Caldwell (rferry@brwncald.com or 925-872-7264)
CSIA Discounts PCE Biodegradation as Source of TCE in Municipal Wellfield
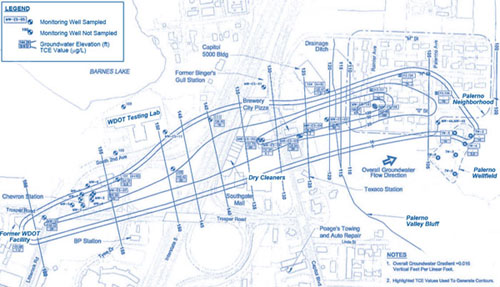
U.S. EPA's Region 10 conducted CSIA in 2006 to help refine the conceptual site model at the Palermo Wellfield Superfund site in Tumwater, WA, located just south of Olympia. Following detection of TCE in the municipal water supply in 1993, groundwater investigations identified dissolved contaminant plumes of TCE and PCE in area groundwater and several potential source areas. Results of CSIA using stable carbon isotopes indicated that upgradient locations of Washington Department of Transportation (WDOT) laboratories, rather than biodegradation of PCE released from a dry cleaner, were the likely source of TCE in the well field.
The Palermo Wellfield lies within the Deschutes River Valley, east of a 60-foot-high bluff atop which sit several commercial businesses and potential source areas. The Palermo neighborhood borders the wellfield to the northwest (Figure 4). Municipal wells of the wellfield are completed in fluvial sand and gravel, while the upland area is underlain by glacial outwash sands and till. The glacial deposits are unconfined and hydraulically connected to the fluvial sediments in the valley. Depth to groundwater in the uplands ranges from 10 to 55 feet bgs and from 4 to 8 feet bgs in the valley, with groundwater flow to the northeast.
Early detections of TCE in the wellfield ranged from 0.9 to 14 µg/L TCE, exceeding the 5 µg/L drinking water standard. Detection of TCE prompted a 1997 removal action involving wellhead treatment of the municipal water supply by air stripping. A subsequent groundwater investigation initially identified an upgradient dry cleaning facility as a potential source of TCE due to the past disposal of PCE in an onsite dry well and suspected biodegradation of the PCE to TCE through anaerobic dechlorination. Concentrations of PCE measured in soil at the dry cleaners were as high as 63.2 mg/kg. As part of a 1998 removal action, a soil vapor extraction (SVE) system was installed to remove PCE from soil at the property.
In the subsequent remedial investigation, the TCE plume was found to originate in the uplands west of the wellfield and west of the dry cleaners. The plume extends east-northeast for about a half mile beneath the Palermo neighborhood and wellfield where it is intercepted by the municipal well. The PCE plume, however, was found to be smaller (about 750 feet long), extending northeast from the parking lot of the dry cleaners to the edge of the bluff. The plume stops short of the homes and wellfield. Furthermore, subsurface conditions at the dry cleaners did not appear conducive to anaerobic biodegradation as areas of low dissolved oxygen and oxidation reduction potential were limited. In addition, detections of reductive dechlorination daughter products such as cDCE and vinyl chloride were sporadic, further discounting the dry cleaner as the source of wellfield TCE. The 1999 record of decision (ROD) called for continued operation of wellhead and SVE treatment. The SVE system was shut down in 2000.
In pursuit of another line of evidence, EPA performed CSIA in 2006 to confirm that the dry cleaner was not the source of TCE and to identify other potential sources of the TCE. Groundwater samples were collected as part of semi-annual, long-term groundwater monitoring required by the ROD. Twenty-seven wells and piezometers were sampled for chlorinated solvents and 13C/12C analysis. The quantitation limits for CSIA were estimated to be 20 µg/L for TCE and 30 µg/L for PCE using a purge and trap technique combined with GC-IRMS. TCE concentrations in 10 samples were sufficient to run CSIA. The δ13C values ranged from -22.7‰ to -28.8‰. TCE with δ13C values in the range of -26‰ was detected in wells downgradient of the former WDOT facility at the western extent of the plume (Figure 5), in wells near the WDOT testing lab further downgradient and wells in the Palermo neighborhood near the well field. The PCE detected near the dry cleaners had a δ13C of -33‰.
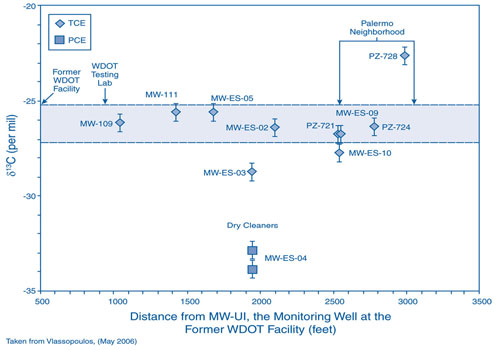
The similarity of δ13C values with increasing distance downgradient supports the conceptual site model suggesting that little degradation of TCE is occurring. That, together with the marked difference between TCE and PCE values, indicates that degradation of PCE from the dry cleaners is not the source of TCE in the Palermo Wellfield or neighborhood. Instead, the former and current WDOT facilities are the likely sources.
A second five-year review in 2008 indicated that, due to the lack of conditions amenable to biodegradation, the TCE plume will degrade as quickly as anticipated; therefore, groundwater will not be restored within the 5- to 30-year timeframe predicted in the ROD. EPA is recommending that the conceptual site model and remedial action objectives be re-evaluated since natural attenuation is not a significant process for reducing TCE and PCE concentrations in the groundwater.
Contributed by Bernie Zavala, EPA Region 10 (zavala.bernie@epa.gov or 206-553-1562)
Upcoming Green Remediation Conference
Registration is now open for the international conference on Green Remediation: Environment, Energy, and Economics on June 15-17, 2010 at the University of Massachusetts in Amherst, MA. View the preliminary agenda and find more online information through The Environmental Institute at: www.umass.edu/tei/.
Strategy for Characterizing DNAPL
EPA's Office of Research and Development, with assistance from EPA's Ground Water Forum, recently published Assessment and Delineation of DNAPL Source Zones at Hazardous Waste Sites, which provides a framework for assessing the presence of dense non-aqueous phase liquids (DNAPLS) and delineating the spatial extent of a DNAPL source zone (www.epa.gov/ada/pubs/issue.html).
