![]() A newsletter about soil, sediment, and groundwater characterization and remediation technologies
A newsletter about soil, sediment, and groundwater characterization and remediation technologies
- PRB Expanded to Full-Scale Operation for Accelerating Treatment of Metals
- Four-Year Monitoring Shows Source-Area VOC Reductions After ERH/SVE at Naval Station-Annapolis
- Nearly Five Years of SER Approaches Full Treatment of Source Areas at Port of Ridgefield
- Update on EPA Remedial Optimization Studies
This issue of Technology News and Trends provides selected updates on innovative technology applications described in past issues. Some applications moved toward full-scale implementation at previous study sites while others drew sites much nearer to cleanup closure.
PRB Expanded to Full-Scale Operation for Accelerating Treatment of Metals
CLU-IN Resources
The new Sediments contaminant focus area of CLU-IN provides policy and guidance, describes conceptual site models, and discusses the unique aspects of characterizing and remediating contaminated sediment. Learn more at: www.clu-in.org/contaminantfocus.
A five-year evaluation of a pilot-scale, sulfate-reducing permeable reactive barrier (SR-PRB) installed at the Stoller Chemical Site in Jericho, SC, in 2004 recently led to installation and implementation of a full-scale SR-PRB. [See the February 2006 issue of TNT for details on the pilot-scale project.] After completing an updated feasibility study and record of decision, the South Carolina Department of Health and Environmental Control (SCDHEC) installed the barrier within a two-month period in early 2009 to continue treating groundwater metals of concern.
The SR-PRB was installed immediately downgradient of an onsite contaminant source area, in the vicinity of a groundwater pump and treat (P&T) system that had operated on an interim basis since 2002. In 2009, when P&T operations were terminated and the system was dissembled to create space for the barrier, concentrations for contaminants of concern (COCs) in source-area groundwater were 22 µg/L arsenic, 160 µg/L chromium, 0.25 mg/L cadmium, 3.7 mg/L copper, 0.66 mg/L nickel, 19 mg/L manganese, 25 mg/L zinc, 250 mg/L aluminum, and 69 mg/L iron.
Project designs called for a continuous V-shaped SR-PRB approximately 380 feet long, 12 feet wide, and 13 feet deep. The barrier was keyed into an underlying confining unit at a depth of 13-23 feet below ground surface (bgs). The groundwater flow rate in this area is estimated at 0.36 ft/day.
SR-PRB construction involved sequential framing, excavation, and filling of 12 individual cells approximately 32 feet long. Due to the occurrence of flowing sands, each cell was constructed by installing rigid sheet piling along the sides of the trench and attaching the piling to a rectangular frame of 12-inch steel to prevent inward collapse. A conventional backhoe was used to remove approximately 185 yd3 of soil from each braced cell and fill the trench with sulfate-reducing amendments. The steel bracing was then moved to the next cell, where the process was repeated. Trench spoils were placed in other areas of the site for reuse.
Selection of amendment materials was based on their capability to enhance growth of sulfate-reducing bacteria that convert soluble metallic sulfates to insoluble metallic sulfides, thereby removing the dissolved metals from groundwater. The selected amendment mixture for each cell contained 38% wood chips, 32% hay and alfalfa, 17% sawdust with trace amounts of cement kiln dust, 7% limestone screenings, and 6% cow manure.
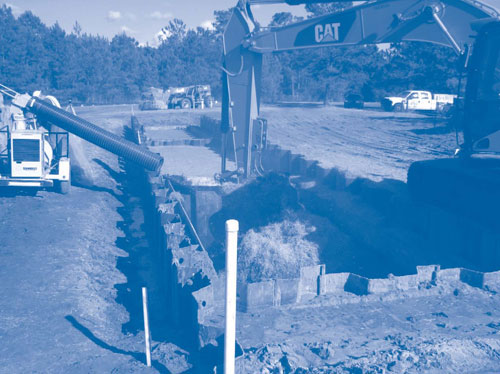
The amendments were mixed directly within each excavated cell in three separate lifts (Figure 1). Any seepage water and a few gallons of groundwater were added to the mixture to facilitate mixing of each lift. After the third lift was emplaced, approximately 100 gallons of additional contaminated groundwater from an adjacent well were pumped into the cell.
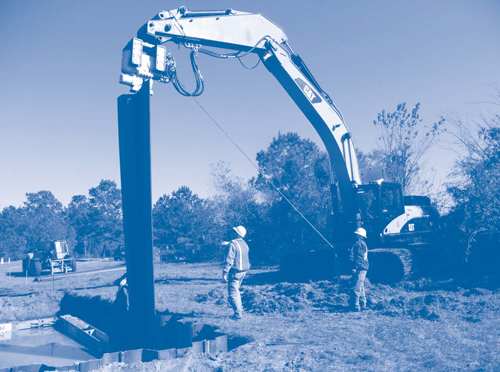
The entrenched materials were allowed to incubate until the oxidation-reduction potential reached -100 mV or lower, which typically required two weeks. Following incubation, the sheet piling was removed (Figure 2) to allow flow of contaminated groundwater through the filled cell and for reuse in construction of the next cell. A final cover comprising an impermeable liner topped by a 24-inch layer of soil was then installed in each cell and graded to prevent excessive infiltration by rainfall.
The completed SR-PRB contained a total of 672.83 tons of amendments consisting of 225.28 tons (900 yd3) of wood chips, 67.27 tons of hay and alfalfa (3,372 bales), 111.05 tons of sawdust (397 yd3), 6.73 tons of cement kiln dust (10 yd3), 195.17 tons (174 yd3) of limestone, and 67.33 tons (133 yd3) of manure. By sequencing and overlapping construction components for individual cells, construction of all 12 cells was completed over 60 days, one month ahead of schedule.
Detailed water quality monitoring in March 2010 (approximately one year after groundwater began flowing through the entire SR-PRB) indicated that water in all three downgradient performance monitoring wells contained COC concentrations below the maximum contaminant levels of 0.01 ppm arsenic, 0.005 ppm cadmium, 0.1 ppm chromium, 0.1 ppm nickel, and 1.3 ppm copper. Site-specific remedial goals for aluminum (16.9 ppm), manganese (5 ppm), and zinc (5 ppm) set forth in the revised record of decision were met at all three downgradient monitoring points. The site-specific goal of 10 ppm for iron was met in two of the three monitoring points; at the third, iron concentrations decreased to 27 ppm.
SCDHEC estimates that the cost of installing the PRB was equivalent to the cost of approximately three years of the former P&T operations. The system’s lifespan is estimated at 15 years, without any need for replenishment or replacement of the reactive media.
Two additional SR-PRBs are planned for the offsite residential area across the street from the Stoller property to intercept the downgradient toe of the contaminated groundwater plume and prevent discharge of contamination to the area's wetlands. Modeling estimates that the maximum concentration of cadmium (the primary offsite COC) likely present as a residual solid within the anticipated barrier would not exceed the 70 mg/kg residential screening level for soil.
Contributed by Judy Canova, SCDHEC (canovajl@dhec.sc.gov or 803-896-4046)
Four-Year Monitoring Shows Source-Area VOC Reductions After ERH/SVE at Naval Station-Annapolis
The U.S. Navy applied electrical resistance heating (ERH) and soil vapor extraction (SVE) in 2006 as an interim action to remove 1,1,2,2-tetrachloroethane (TeCA) and trichloroethene (TCE) from source areas at Site 1 of the Naval Support Activity installation in Annapolis, MD (former Naval Station-Annapolis) [see September 2007 TNT]. Analysis of soil samples collected upon complete cooling of the subsurface in January 2009 indicated an average 99.6% reduction in TeCA concentrations and 99.9% reduction in TCE concentrations. Sampling results since then show concentrations in soil remain below the corresponding U.S. EPA industrial standards of 2,900 µg/kg and 14,000 µg/kg. In groundwater of wells adjacent to the treatment area, TeCA and TCE concentrations have decreased an average 98% and 74%, respectively, as a result of ERH/SVE application in the source areas.
Three-phase ERH technology was implemented at Site 1 by way of steam stripping and in situ hydrolysis to convert TeCA to the more volatile TCE and subsequently remove the TCE. Integrated ERH/SVE system components included 24 steel electrodes, a steam condenser, one blower, and a granular-activated carbon filtration (GAC) system. The subsurface soil was heated to temperatures averaging 99°C (210°F) over 116 days, from February to May 2006.
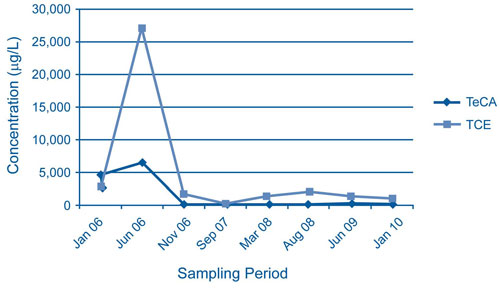
As anticipated, TCE concentrations in the treatment-area groundwater monitoring wells significantly increased immediately after ERH/SVE treatment, which indicated hydrolysis had occurred. Concentrations then dropped to below pre-treatment levels over following months. For example, one treatment-area monitoring well with a TCE concentration of 2,800 µg/L prior to treatment exhibited a concentration of 27,000 µg/L five months later, followed by a concentration below 2,000 µg/L in subsequent monitoring events (Figure 3). The most recent data collected during biannual sampling of wells adjacent to the treatment area show that TeCA and TCE concentrations have decreased to an average of 35 µg/L and 475 µg/L, respectively.
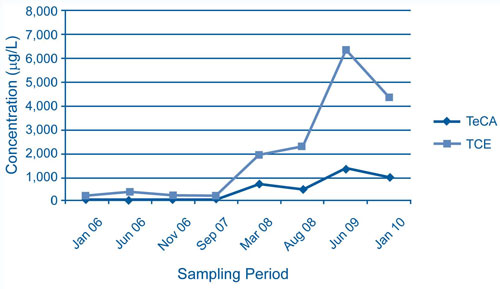
Monitoring downgradient of the source areas indicates that a plume of TCE was released to groundwater during heating of the source areas. Four wells located 250-800 feet downgradient exhibited a peak average increase of 2,060% in volatile organic compound (VOC) concentrations approximately two years after system shutdown. All four wells exhibited a decline of TeCA and TCE concentrations after the second-year sampling event, which suggested that VOC mobilization was temporary. One well approximately 250 feet downgradient, for example, showed a 1,200% and 1,100% increase in TeCA and TCE, respectively, followed by notably lower concentrations seven months later (Figure 4).
The Navy continues to monitor VOCs at Site 1 to evaluate groundwater concentration trends associated with this interim action. Groundwater monitoring costs since the 2006 shutdown have averaged less than $20,000/year.
Contributed by Ryan Mayer, U.S. Navy (ryan.mayer@navy.mil or 202-685-3282) and Steven Kawchak, Shaw Group (sgkawchak@shawgrp.com or 609-588-6349)
Nearly Five Years of SER Approaches Full Treatment of Source Areas at Port of Ridgefield
The Port of Ridgefield (POR), WA, recently began the last phase of steam-enhanced remediation (SER) at the POR’s Lake River Industrial Site (LRIS). Pilot-scale SER was conducted in 2004 to treat soil and groundwater contaminated by wood-treating waste and to prevent nonaqueous-phase liquid (NAPL) from migrating into environmentally sensitive areas. The first phase of full-scale operation was initiated on one acre in 2006 with plans to sequentially remediate three additional 1-acre subareas by 2013-2015 [see September 2007 TNT]. As of December 2009, SER implementation had removed approximately 23,900 gallons of NAPL and fully treated approximately 110 million gallons of groundwater for surface water discharge. Approximately 465 tons of sludge had also been generated through the liquid treatment system and disposed at an offsite hazardous waste landfill.
Remediation of the LRIS is environmentally sensitive due to its proximity to the Ridgefield National Wildlife Refuge (including Carty Lake) and the City of Ridgefield as well as its position on the banks of Lake River, a tributary of the Columbia River. The SER system has focused on removing mobile contaminants in shallow groundwater within the 4-acre NAPL plume, above an aquitard approximately 50 feet bgs.
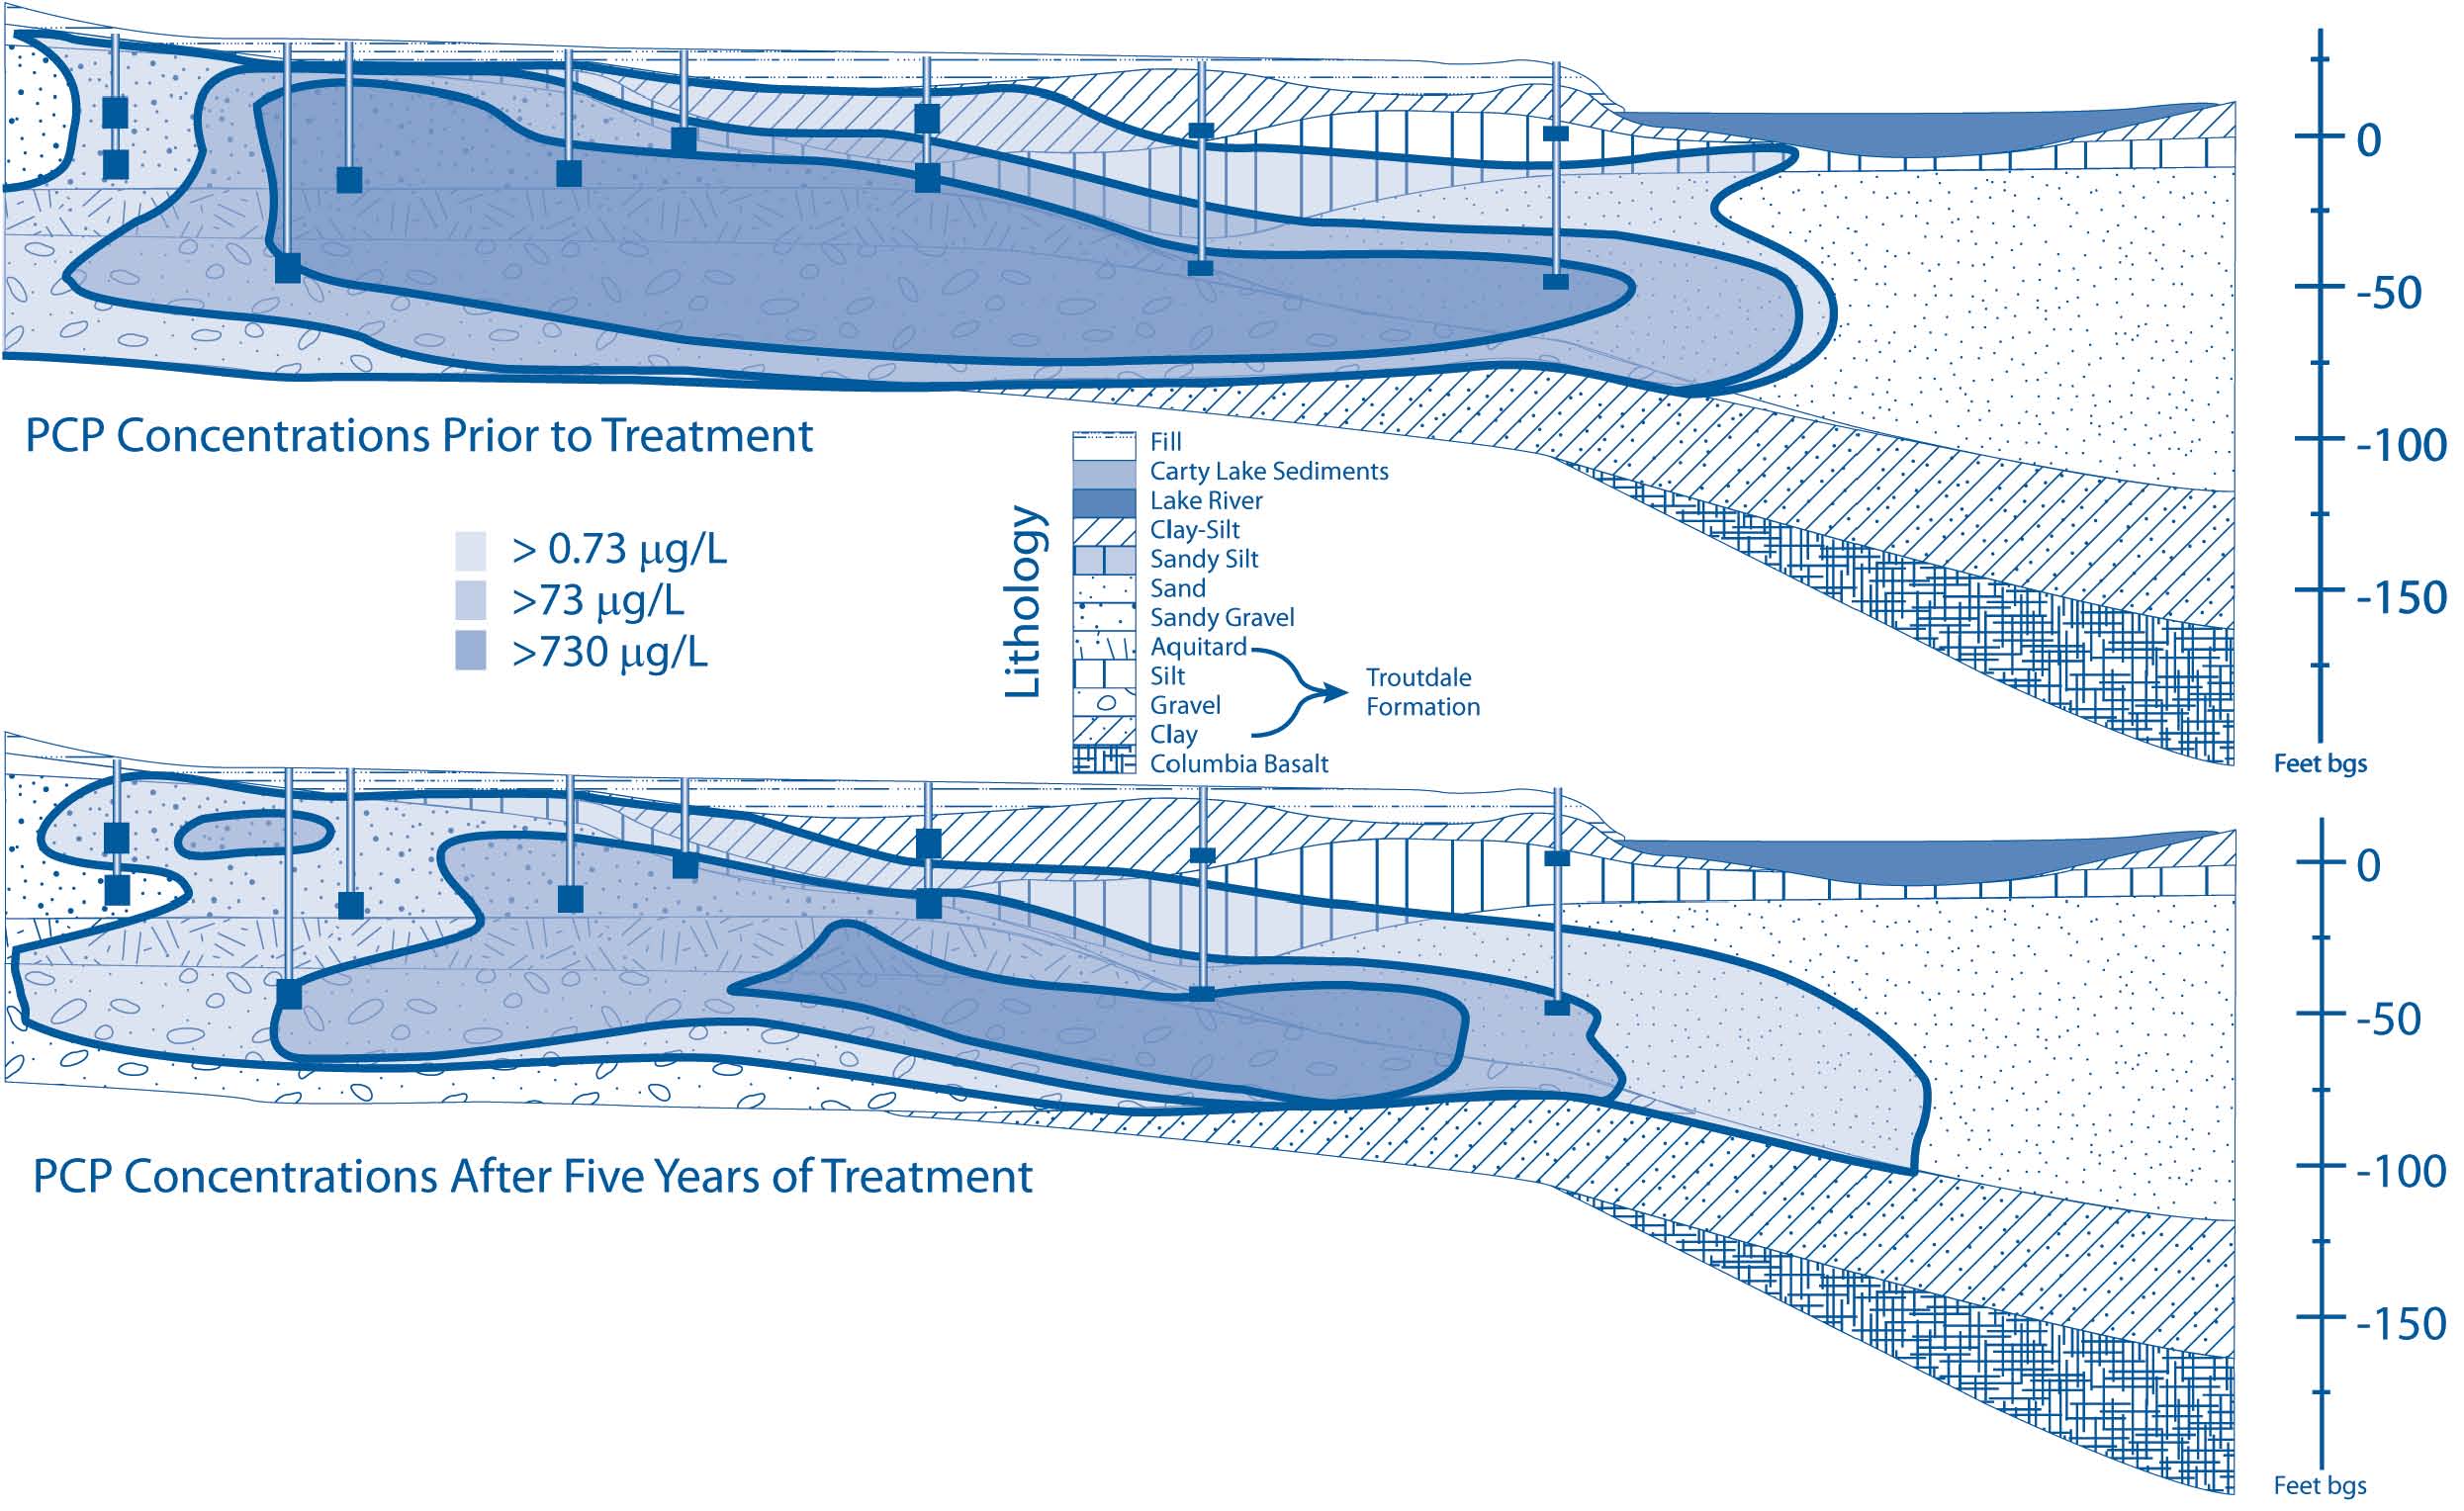
Comparison of contaminant concentrations in system influent collected during the first three months of treatment with influent data gathered in late 2009 indicates significant contaminant reductions: greater than 99.4% for benzene (originally 50 µg/L), 97.7% for pentachlorophenol (PCP) (originally 7,500 µg/L), 99.8% for naphthalene (originally 18,000 µg/L), 90.6% for tetrachloroethene (originally 30 µg/L), and 49% for arsenic (originally 80 µg/L). In addition, dissolved concentrations of PCP (Figure 5) and all other COCs that were historically detected in the upper water-bearing zone beneath Carty Lake were no longer detected and plume migration toward Carty Lake and the Lake River had halted.
Groundwater monitoring shows that the areal extent of light NAPL has decreased 90% from the original estimate of four acres, with no onsite indication of dense NAPL. Approximately 85% of this removal rate is achieved through the onsite vapor treatment system, which includes a heat exchanger, air/liquid separators, air dryers, and two steam-regenerated GAC units. The remaining 15% of NAPL is removed through the liquid treatment system consisting of another heat exchanger, oil/water separators, coagulation/flocculation units, an inclined clarifier, mixed-media filtration, and GAC filters.
POR personnel continue to monitor subsurface temperatures and heat expansion through use of real-time data collection equipment such as digital thermocouples. The rate of steam injection at each active injection well is modified as needed to maintain consistent heating across the entire treatment zone. Temperatures of treatment system influent have averaged 135°F. During active treatment, which averages 180 days for each 1-acre SER phase, a minimum of two staff members monitor the system 24 hours per day, seven days per week.
SER implementation difficulties over the four years of operation have stemmed primarily from the high temperatures needed to operate the system and the corrosive nature of the heated chemicals. Electrical meters, groundwater pumps, and release valves have been subject to frequent maintenance and sometimes degraded in as little as several hours. In particular, frequent breakdown of mechanical pumps led to their replacement by field-modified airlift pumps with few moving parts.
Operational costs have averaged approximately $400,000 per month. Of this, approximately 40% can be attributed to natural gas that is consumed at an average rate of 4,900 therms per day. To control the energy costs, the POR established a goal of heat energy input of 500 kWh for each cubic meter of soil across the treatment area.
Concentrations of total contaminants in groundwater influent have averaged 7.5 mg/L since 2004 startup. Based on this effluent concentration, the POR estimates that the amount of contaminant removed through SER over four years was equivalent to the amount potentially removed by exclusive use of a P&T system over 140 years. The POR plans to operate the SER system through June 2011, when all mobile NAPL is expected to be removed from the source area. Potential risk associated with residual, non-mobile contamination in the treatment zone is currently under assessment.
Contributed by Brent Grening, Port of Ridgefield (bgrening@portridgefield.org or 360-887-3873) and Alan Hughes, Maul Foster & Alongi, Inc. (ahughes@maulfoster.com or 360-433-0217)
Update on EPA Remedial Optimization Studies
The U.S. EPA's Office of Superfund Remediation and Technology Innovation completed three additional remediation system evaluations (RSEs) this year as part of an ongoing initiative to optimize P&T and other remedial systems financed and managed by Superfund authorities and participating states. The recent RSEs were conducted at the:
- 10th Street Superfund Site, Operable Unit 2, in Columbus, NE
- Alaric, Inc. Superfund Site in Tampa, FL, and
- Millcreek Dump Superfund Site in Erie County, PA.
Each RSE report provides recommendations on P&T protectiveness, cost-effectiveness, and potential technical improvements, and outlines options for gaining site closure and improving sustainability of long-term applications. Recommendations often involve system modifications to accommodate site conditions that have changed over time, such as:
NGWA Offers NAPL Training
The National Ground Water Association will hold a three-day course on Understanding Migration, Assessment, and Remediation of Non-Aqueous Phase Liquids, on August 2-4, 2010, in Boston, MA. For more information about this short course, visit the NGWA at: www.ngwa.org/development.
- Removing or adding equipment or processes to a treatment train
- Reducing sampling frequency or the numbers of samples collected for long-term monitoring, and
- Identifying the need for additional study of secondary issues such as vapor intrusion into onsite or offsite buildings.
To view final reports on RSEs conducted at 45 Superfund sites to date, as well as additional evaluations completed under regional pilot programs and at RCRA sites (including those addressing underground storage tanks), visit: www.clu-in.org/RSE.
