![]() A newsletter about soil, sediment, and groundwater characterization and remediation technologies
A newsletter about soil, sediment, and groundwater characterization and remediation technologies
- Biological PRB Application Expanded to Accelerate Perchlorate Degradation in Ground Water
- Aquifer Monitoring Shows Complex-Sugar Flushing Increases Potential for Enhanced Biodegradation
- Combined Treatment Technologies for TCE Removal Approach Cleanup Closure
- Pilot Tests Lead to Expanded ISCO for Vadose-Zone Remediation
- Anacostia River Demonstration Finds Active Caps Effectively Contain Sediment Contaminants
This issue of Technology News and Trends looks back to find lessons learned from projects described in earlier issues of the newsletter. These site-specific updates encompass expanded field operations, the results of longer-term monitoring, techniques for system optimization, and progress toward cleanup closure.
Biological PRB Application Expanded to Accelerate Perchlorate Degradation in Ground Water
The success of biological permeable reactive barriers (PRBs) in treating contaminated ground water at the Naval Weapons Industrial Reserve Plant in McGregor, TX, led to construction of a second PRB system comprising 7,000 feet of treatment trenches in 2004-2005. [For more information on the initial PRB system, see the February 2004 Technology News and Trends.] Each PRB system targets one of three contaminated ground-water plumes migrating within separate drainage areas toward drinking-water reservoirs that serve 500,000 people in central Texas. The treatment systems are designed to reduce the mass of commingled contaminants in the source area, prevent contamination from exfiltrating to surface water, remediate shallow ground water on offsite property within 15 years, and prevent further migration of contaminated ground water offsite.
Burn pads and material burial sites of the facility’s former open burning/open detonation area were identified during early site investigations as the source of ground-water contamination. Contaminants include perchlorate in concentrations up to 1,500 parts per billion (ppb) and trichloroethene (TCE) with its associated daughter products in similar concentrations. Field studies show that perchlorate is the only contaminant migrating offsite. As part of the facility-wide remediation plan, contaminated soil from the burial sites was excavated for offsite disposal and a RCRA landfill cap was constructed over the burn pad in 2002.
Both PRB systems involved placement of 2.5-foot-wide barriers (operating in series) in the area’s shallow, weathered limestone, which keys into a non-water-bearing zone 10-25 feet below ground surface (bgs). Trenches were constructed using a trackhoe and/or rock trencher and backfilled with coarse gravel, wood chips saturated with vegetable oil, and compost. Slotted polyvinyl chloride piping was installed six inches above the trench bottoms to facilitate eventual replenishment of organic substrates. The initial PRB system, which was completed in 2002 to address the first fully delineated plume, employs seven trenches totaling 4,500 linear feet. The second system employs 54 trench segments and totals 7,000 feet.
From the onset of operations, perchlorate and volatile organic compound (VOC) concentrations in ground water exiting the final barrier of each PRB system have been reduced to non-detect levels. By the end of the second year of operation, in Fall 2004, the perchlorate mass in ground water decreased approximately 50%, and offsite cleanup was 5-8 years ahead of schedule. Extensive ground-water sampling in January indicated that perchlorate concentrations in many locations are below 0.43 ppb, significantly below the State of Texas 17-ppb residential cleanup standard for perchlorate.
Concurrent to startup of the initial PRB system, the Navy initiated a multi-year study at the McGregor facility to identify geochemical parameters indicating when rejuvenation is needed and to establish engineering protocols for rejuvenation. The study found that:
- Total organic carbon (TOC) is the most reliable indicator of perchlorate breakthrough. At most sampling locations where breakthrough appeared imminent, diminishing TOC concentrations (to below 10,000 ppb) were identified.
- At several locations where nitrate concentrations began increasing (to above 100 ppb), perchlorate concentrations began increasing from non-detect levels to above site cleanup goals. This correlation suggests that nitrate breakthrough is a precursor to perchlorate breakthrough.
- As long as oxidation-reduction potential (ORP) remained below -50mV, perchlorate usually existed at non-detect levels. When ORP increased above this critical value, perchlorate concentrations began to exceed site cleanup goals.
- Several sampling locations also showed an increase in perchlorate concentrations when methane concentrations exceeded 2,000 ppb, which suggests that methane at specific threshold values indicates sufficient reducing conditions exist for perchlorate biotreatment.
- Dissolved oxygen (DO) concentrations did not correlate highly with the onset of perchlorate breakthrough and are unlikely indicators of potential breakthrough or rejuvenation needs.
- Concentrations of humic, fulvic, and volatile fatty acids were more useful for understanding organic substrate behavior rather than signaling perchlorate breakthrough and the need for rejuvenation.
Based on the study findings, the Navy issued an operations and maintenance (O&M) manual last year for the McGregor PRB systems. The O&M process includes a matrix-based decision tool that scores geochemical parameters indicating when rejuvenation of organic substrate is needed. To ensure that rejuvenation occurs prior to any breakthrough, the decision matrix includes a safety factor.
Monitoring of PRB and geochemical parameters indicate that the initial system now requires its first organic-substrate replenishment after 3.5 years of operation. Fresh carbon sources will be injected into the piping of each of the seven trenches this summer in accordance with the new O&M manual. Engineering protocols during the rejuvenation process will address the use of perforated piping, manifold, and substrate feed systems; installation of permanent injection ports; ease of injection; applicability and frequency of vegetable oil emulsions; and evaluation of costs.
At locations where topographic conditions prevented installation of PRB trenches, relatively inexpensive bioborings were installed to further prevent offsite migration of contaminated ground water.This technology employs 10- to 12-inch-diameter boreholes that extend into the non-water-bearing zone and contain biologically reactive media. At McGregor, these borings were drilled on 10-foot spacing in three parallel but offset rows. The boreholes were backfilled with the same gravel/organic media used in the trenches, and capped at 2 feet bgs. Nearly 1,300 bioborings currently complement the biological PRBs. Performance evaluation of 200 early bioborings that were installed during a 2000 pilot study suggests a minimum lifespan of six years.
Contributed by Mark Craig, U.S. Navy/NAVFAC South Division (mark.craig@navy.mil or 843-820-5517), Alan Jacobs, EnSafe (ajacobs@ensafe.com or 901-372-7962), and Ronnie Britto, EnSafe (rbritto@ensafe.com or 901-372-7962)
Aquifer Monitoring Shows Complex-Sugar Flushing Increases Potential for Enhanced Biodegradation
Aquifer flushing was conducted on a site at the Naval Amphibious Base Little Creek (NABLC) in Virginia Beach, VA, in 2002 to remove dense non-aqueous phase liquid (DNAPL). The flushing system employed a solution containing cyclodextrin (CD) to increase solubility and removal efficiency of chlorinated solvents. The extracted CD solution was treated through air stripping and reused in a subsequent flushing event. Within six months of the injections, preliminary results indicated a 50% removal of DNAPL, which contained primarily trichloroethene (TCE). [For details on this application, view the January 2003 Technology News and Trends.] More complete analysis of contaminant levels in the extracted solutions now confirms that cyclodextrin-enhanced flushing (CDEF) resulted in a 19-fold improvement in the volumetric rate at which chlorinated solvents could be extracted from a DNAPL-contaminated aquifer.
Researchers from Louisiana State University (LSU) and the University of Rhode Island (URI) conducted a ground-water monitoring program over the last three years to evaluate the long-term impact of residual CD in the aquifer. The unconfined aquifer consists primarily of sorted sand with an average porosity of 31%, and the average ground-water flow velocity is 9 cm/day. Ground-water geochemistry parameters and contaminant concentrations were tracked for 14 months during three sampling rounds after the final flushing event, on days 210, 342, and 425.
During each round, conditions were measured at eight wells in the CD treatment zone and at another eight wells located within 100 meters of the treatment zone. Geochemical parameters that were measured in the field using portable equipment included temperature, pH, electroconductivity, ground-water flow velocity, depth, and terminal electron acceptors (TEAs) (DO, sulfate, nitrate, and total iron). Laboratory analyses of ground-water samples was conducted to determine TOC content and the concentrations of target compounds, primarily TCE and 1,1,1-trichloroethane (TCA) and its degradation product 1,1-dichloroethene (DCE).
TOC was used as a cost-effective measure of the effective concentration of CD and its metabolites because residual CD concentrations exceeded naturally occurring organic-carbon concentrations (0.25 g/L) by more than two orders of magnitude. In the three sampling rounds, TOC analysis showed that average concentrations within the CD treatment zone were 6.32 g/L, 3.55 g/L, and 2.07 g/L, respectively. Data showed that only one-third of the CD remained in the aquifer 425 days after the final flushing event, but that TOC remained in average concentrations eight-fold above background.
Persistence of TOC in the CD injection zone also was associated with lower levels of DO, nitrate, and sulfate (respectively 46%, 81%, and 98% lower than background). At the beginning of the post-flushing monitoring period, DO averaged 0.44 mg/L in the wells outside the treatment zone and 0.24 mg/L within the zone. During the two later sampling rounds, DO levels within the treatment zone increased to 0.27 mg/L and then to 0.38 mg/L. These levels were considered insufficient to support effective aerobic biodegradation of the CD, since typical carbon sources require a minimum DO concentration near 2 mg/L.
Nitrate analysis on samples from the second and third rounds of sampling showed that concentrations were below the detection limit (0.1 mg/L) within the treatment zone and ranged from 0.1 to 0.8 mg/L with an average of 0.48 mg/L outside the zone. Sulfate concentrations also inversely related to TOC. At the 10 sample locations where TOC levels exceeded 1 g/L (averaging 4.24 g/L), sulfate concentrations ranged from below 0.1 to 2.0 mg/L with an average of 1.14 mg/L. At the 12 locations where TOC levels were below 1 g/L (averaging 0.32 mg/L), sulfate concentrations ranged from 0.4 to 51.3 with an average of 13.7 mg/L. Unlike the other TEAs, iron showed no correlation with TOC or other ground-water quality parameters. These findings suggest that subsurface injection of CD provided an effective carbon source for increased bioactivity in the aquifer and produced anaerobic conditions, thereby producing a favorable environment for microbial degradation of the highly chlorinated contaminants.
Over the monitoring period, aqueous concentrations of 1,1-DCE, 1,1,1-TCA, and TCE within the injection zone decreased 38%, 81%, and 94%, respectively. Reduction of contaminants in monitoring wells outside the injection zone could not be estimated with high confidence because those concentrations were at or below analytical detection limits. As such, the outside monitoring wells served as poor experimental controls and could not provide circumstantial evidence that residual CD solutions acted as secondary means of remediation for highly chlorinated organic solvents.
Monitoring of aquifer temperature, pH, and ground-water flow indicated no biofouling and suggests that CD concentrations will decrease to pre-flushing concentrations in approximately two years. Although CD-enhanced biodegradation was not the primary treatment objective at this site, the CDEF process apparently benefited from the presence of residual CD solution. Additional research is needed to evaluate the feasibility of injecting CD solely for the purpose of enhanced biodegradation.
The U.S. Department of Defense’s Environmental Security Technology Certification Program (ESTCP) completed a cost and performance analysis of CDEF implementation at the NABLC. (The full report is available at http://www.estcp.org/documents/techdocs/cu-0113.pdf.) When comparing CDEF to alternate remediation technologies, the analysis indicates CDEF capital costs (totaling $296,000) were 150% more than conventional pumping and treatment but only 33% of the potential cost for surfactant-enhanced aquifer remediation (SEAR). Significant differences also were identified in O&M costs, which were estimated at $498,000 for SEAR, $1,197,000 for CDEF, and $1,385,000 for pumping and treatment.
While total implementation costs for these technologies are comparable, both CDEF and SEAR technologies significantly reduce the time needed for complete remediation. CDEF also offers the benefit of introducing only nontoxic and degradable material into the subsurface. ESTCP analysis of CDEF performance indicates that the technology is most suited to removal of residual NAPL; its use for free-moving NAPL should follow other technologies such as free-product skimming. The technology is appropriate for use in lowering contaminant concentrations sufficiently to allow otherwise unfeasible remediation approaches such as enhanced bioremediation.
Contributed by William Blanford, LSU (blanford@geol.lsu.edu or 225-578-3955), Thomas Boving, Ph.D., URI (boving@uri.edu or 401-874-7053), and Roy Wade, U.S. Army Engineer Research and Development Center (roy.wade@erdc.usace.army.mil or 601-634-4019)
Combined Treatment Technologies for TCE Removal Approach Cleanup Closure
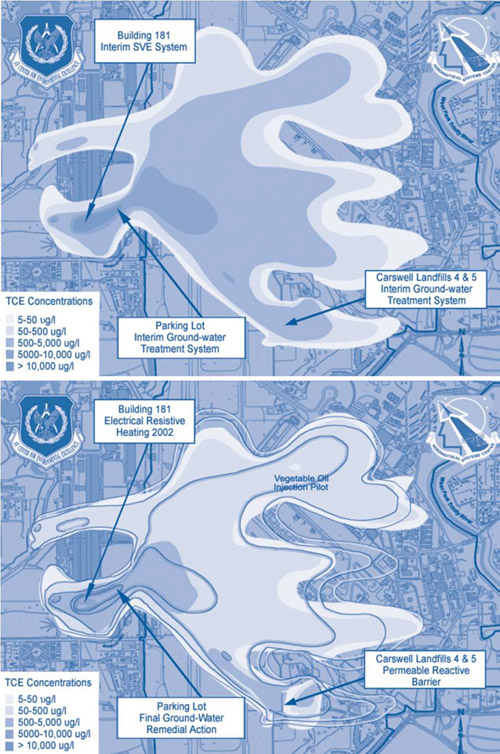
Use of soil vapor extraction (SVE) partially enhanced by electrical resistance heating (ERH) at the Air Force Plant 4 (AFP4) in Forth Worth, TX, over the past 13 years has resulted in successful removal of volatile and semi-volatile contaminants in the site's vadose and saturated zones. Treatment of the contaminated soil and ground water posed unique challenges due to the presence of TCE in the vadose zone directly below the plant's "Building 181." In one of the building’s monitoring wells, TCE concentrations were as high as 1,400 mg/L.
The area under Building 181 is the primary source of the AFP4’s operable unit 1 (OU1) ground-water contaminant plume. As part of the OU1 source-area remediation plan, vadose-zone treatment was needed to prevent TCE migration into the alluvial ground-water system, which in turn threatened the regional aquifer. The vadose-zone TCE under the building serves as a source of ground-water contamination under an adjacent parking lot. Alluvium in this area consists of clayey fill and gravelly clay with low permeability, conditions shown in the past to be amenable to SVE applications.
In 1993, the U.S. Air Force (USAF) constructed an SVE pilot system. The system employed eight extraction wells, seven of which extended up to five feet bgs and one which extended 35 feet bgs into the alluvial terrace. It also included 19 soil-gas monitoring probes, a 7.5-horsepower blower for vapor extraction, and two 3,000-pound carbon vessels for TCE removal. The first 90 days of SVE operations resulted in removal of 4,400 pounds of TCE.
Following three years of successful pilot operations, SVE was selected as the final remedy for AFP4 and major system upgrades were initiated. The full-scale system included 36 soil-gas extraction wells, three dual-phase extraction wells, and numerous soil-gas probes and piezometers to measure system performance. An additional vacuum blower, expanded piping network, and a new semi-permanent operations building also were added. Instead of the vapor-phase carbon adsorption used during the pilot, catalytic oxidation vapor treatment technology (COVTS) was installed to treat recovered TCE vapors.
The full-scale SVE system began operating on a continuous basis in March 2000. During its six-month startup, the system removed 1,521 pounds of TCE. As influent concentrations declined, the COVTS equipment became uneconomical to operate and was replaced in May 2002 with activated carbon adsorbers. At that time, analytical sampling indicated TCE concentrations in source-area soil were slightly above the 11.5-mg/kg cleanup goal, and higher TCE concentrations were detected at some locations near the original release area. A review of the system’s long-term performance indicated that the application of an additional treatment technology in the source area would likely accelerate cleanup and achieve the remedial action objectives.
Based on the site characteristics, technology screening, and pilot-test results, a full-scale ERH system was installed in 2002 to enhance source-area treatment efficiency. ERH technology employs electrical resistance to heat contaminated soil, thereby helping to vaporize residual contaminants, ground water, vadose-zone moisture, and perched water. The system targeted 27,000 cubic yards of contaminated soil in a 0.5-acrea area under the floor of the building. A total of 63 ERH electrodes and co-located vapor and steam recovery wells operated continuously over nine months. [See the December 2004 Technology News and Trends for details on this application.] Existing SVE pipes, wells, and auxiliary equipment were used for ERH implementation.
The combined SVE-ERH treatment approach removed 1,743 pounds of TCE. The ERH system was shut down in December 2002 when cleanup goals for both soil and ground water in the target area were met at 11.5 mg/kg and 10 mg/L, respectively. (One well (MV-10) could not be heated due to equipment failure and still contained elevated TCE concentrations; the USAF will apply a localized treatment if monitoring does not indicate a trend of decreasing TCE concentrations in the well.) The aboveground ERH system and ancillary equipment were removed in 2003, while the SVE and monitoring systems continued to operate. Temporary shutdowns of the SVE system occurred periodically to evaluate soil-vapor rebound, and only minimal rebound was detected.
Monitoring throughout 2004-2005 showed an average mean TCE concentration in soil of 0.184 mg/kg, significantly below the 11.5-mg/kg target for OU1. The mean TCE concentration in ground water also was far below its 10-mg/L target, and averaged 4.1 mg/L. Downgradient dual-phase extraction wells with concentrations exceeding 20 mg/L before SVE-ERH treatment now exhibit TCE concentrations below 1 mg/L, well below the remediation target (Figure 1). As a result, the USAF currently is shutting down the SVE system, evaluating the MW-10 well area, and conducting any final remedial actions in preparation for OU1 clean-up closure later this year.
Contributed by George Walters, Aeronautical Systems Center/Engineering Directorate (george.walters@wpafb.af.mil or 937-255-1988)
Pilot Tests Lead to Expanded ISCO for Vadose-Zone Remediation
Following successful pilot-scale field testing of in-situ chemical oxidation (ISCO) in 2001, the USAF began an expanded-scale application in 2003 to remove chlorinated solvents from an upgradient source area at Air Force Plant 44 in Tucson, AZ. [For information on site conditions and details concerning the pilot test, see the January 2003 issue of Technology News and Trends.] During both the pilot and expanded operations, potassium permanganate solutions were injected to remove residual high concentrations of TCE from fine-grained alluvial sediments in the upper part of the regional aquifer.
The expanded-scale treatment area, known as IRP Site 2, covers approximately 12 acres and is the most upgradient and heavily contaminated source area for a two-square-mile plume of TCE-contaminated ground water. A pump-and-treat system has operated since 1987 for plume remediation, and a former SVE system removed more than 75,000 pounds of TCE from vadose-zone soil. Despite SVE success, TCE concentrations in ground water remained elevated in vadose soil extending to a depth of 150 feet. Injection of potassium permanganate in a single well during the August 2001 pilot test produced a localized, temporary decrease in TCE concentrations.
In January 2003, the USAF began the large-scale ISCO effort involving single injections of potassium permanganate in multiple wells across IRP Site 2. Sixteen former SVE wells were used to inject into the lower vadose zone, and eight ground-water wells were used to inject directly into the upper part of the regional aquifer. To reflect 2001 pilot-test results suggesting that the use of greater volumes of more dilute solutions may increase effectiveness, potassium permanganate was injected in concentrations of 0.3-0.5% rather than the 2% solution previously used. A total of 16,000 pounds of potassium permanganate were injected. To enhance operation ease and reduce intrusive activities, the 20,000-gallon batch-tank system used in the pilot test was replaced by a portable flow-through system tailored for potassium permanganate delivery in the expanded injection program. Both vertical and horizontal flooding techniques were used.
Monitoring methods and frequencies were optimized to reflect University of Arizona research findings from the pilot-scale application. Monitoring was conducted quarterly rather than weekly due to the slow changes occurring in subsurface conditions. In addition, the large-scale application focused on key ground-water monitoring parameters that included ORP, temperature, pH and conductivity, and color (purple indicating the presence of potassium permanganate). Quarterly monitoring also included laboratory analysis of ground-water samples collected within and downgradient of the treatment area to determine changing TCE concentrations.
Three years after the large-scale injections, active (based on observed color) potassium permanganate remained in the injection wells to varying degrees and for varying durations. This persistence was attributed to the aquifer’s low TOC content, which was estimated at 0.1%. TCE concentrations in the treatment wells began to rebound over time at differing rates. As a result, an additional 4,600 pounds of potassium permanganate were injected last fall using the same field methods in 10 selected wells: three previously-treated regional aquifer wells, two previously-untreated regional aquifer wells, and five previously-untreated vadose-zone wells.
To measure treatment effectiveness, pre- and post-injection TCE concentrations were compared in ground-water samples collected from 17 wells for which complete data were available. Laboratory analysis of samples collected in November 2001, before the initial injection, indicated TCE concentrations averaging 297 µg/L. Post-treatment samples collected this past February (two months after the final injection) contained TCE concentrations averaging 18.4 µg/L, demonstrating a 94% reduction. The USAF anticipates continued operation of the IRP Site 2 pump-and-treat system, and additional ground-water treatment, if needed. ISCO field-testing (but without the same degree of research activities) also was performed at IRP Site 3 in 2001 and expanded to a large-scale system in 2004-2005.
Contributed by George Warner, USAF (george.warner@wpafb.af.mil or 937-255-3241) and Timothy J. Allen, Raytheon (tjallen@raytheon.com or 520-794-9450)
Anacostia River Demonstration Finds Active Caps Effectively Contain Sediment Contaminants
In March 2004, innovative cap materials were placed in the Anacostia River in Washington, DC, to demonstrate their applicability for management of sediment contaminants. Conventional sand caps are designed to reduce contaminant release from sediments by physically isolating contaminants from organisms and the water column. The active capping process underway at the Anacostia, however, involves covering contaminants with layers of alternative materials that offer treatment and/or sequestration of contaminants.
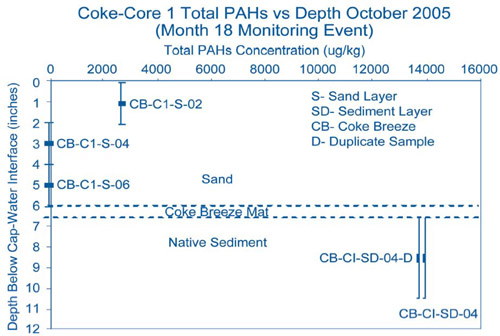
Following extensive site characterization studies and two years of laboratory treatability studies, three alternative cap technologies were included in the demonstration: AquaBlok™, apatite, and coke breeze in a laminated mat [see the May 2004 Technology News and Trends for details on the technology selection process]. Six-inch layers of AquaBlok and apatite were emplaced and covered by 6 inches of sand. The 1-inch layer of coke breeze in a laminated mat was also covered with 6 inches of sand. The control area consisted of 1 foot of sand. Monitoring approximately one month after placement confirmed that each of the materials was placed effectively in the river despite a relatively crude placement approach and the thin target thickness. The average variation in layer thickness was approximately 30%, with less than one to two inches of intermixing with underlying contaminated sediments.
AquaBlok, apatite, and sand were placed using conventional clamshell bucket techniques. Placement was monitored through use of a high-resolution digital global positioning system attached to the arm of the crane. Coke breeze in the laminated mat was emplaced by tacking one end of a 10-foot-wide, 100-foot-long roll of mat and unrolling it through use of a crane. Divers then ensured proper placement of each roll, with small overlaps. Laminated mat was selected for the coke placement due to the low density of coke and the relatively high fraction (10-20%) of non-settleable material that likely would result if coke were placed through conventional techniques.
Performance monitoring was conducted at six and 18 months after cap placements. Geophysical parameters were used to evaluate any changes in bathymetry and to identify changes in surficial site characteristics such as the deposition of new fine-grained sediments. Sediment coring also was conducted to determine vertical profiles of contaminant concentrations. Innovative monitoring approaches employed on the low-permeability AquaBlok cap included the use of seepage meters to evaluate any reductions in ground-water flow and an inclinometer to detect small vertical deflections that may occur due to tides or gas movement.
The influence of AquaBlok, for which the primary objective is permeability control, could be measured immediately. Seepage meters during the two monitoring events showed significant reductions in ground-water flows, from 1-5 cm/day to significantly less than 1 cm/day. The low permeability of AquaBlok also led to accumulation and irregular release of gas from this cap material, although without apparent enhancement of contaminant migration or decrease in long-term cap performance.
Monitoring results confirm that extensive time is needed for polycyclic aromatic hydrocarbons (PAHs) and metal contaminants to migrate within the materials, which allows for extended intermixing of the cap material and underlying sediment. Results also indicate that all of the cap materials, including the sand control plot, are effectively containing contaminants. For example, data indicate that the coke breeze mat efficiently contains PAHs near the surface (Figure 2), particularly due to movement of new contaminated sediment onto the surface of the cap.
Long-term effectiveness of the active cap materials and performance relative to the sand control will be evaluated again this Fall for 2006, 30 months after placement. The demonstration continues to show that alternative cap materials can be placed effectively in a riverine environment and that all of the caps are efficiently containing contaminants. Monitoring will continue for a minimum of one additional year to better quantify the cap performance and to help identify the performance benefits of active caps over conventional sand caps.
Contributed by Danny Reible, Ph.D., University of Texas (reible@mail.utexas.edu or 512-471-4642)
