![]() A newsletter about soil, sediment, and groundwater characterization and remediation technologies
A newsletter about soil, sediment, and groundwater characterization and remediation technologies
- Enhancement of Anaerobic Mulch Bioreactor Involves Emulsified Vegetable Oil and Iron and Sulfate Amendments
- EPA Analyzes Superfund Remedy Trends Over Recent Years
- Sediment Cleanup Remedy for Lower Fox River Reaches 25% Construction Completion
- EZVI Injection Field Test Leads to Pilot-Scale Application
This issue of Technology News and Trends (TNT) provides site-specific updates about innovative cleanup technologies and methods described in past issues. Recent work at these sites involved testing materials to improve technology performance, integrating advanced equipment to improve field and project management efficiencies, and developing "lessons learned" to aid technology applications at other sites.
Enhancement of Anaerobic Mulch Bioreactor Involves Emulsified Vegetable Oil and Iron and Sulfate Amendments
CLU-IN Resources
The U.S. Environmental Protection Agency (EPA) Technology Innovation and Field Services Division now offers a Passive Samplers focus area on the CLU-IN Website. The area describes sampler components and operation, target analytes, costs, advantages, limitations, and application examples for no-purge devices categorized as thief (grab), diffusion (equilibrium), or integrating (kinetic) samplers. Visit the new focus area through: http://clu-in.org/characterization/technologies/
default.focus/sec/Passive_%28no%20purge%29_
Samplers/cat/Overview/. To learn about other new CLU-IN resources as they become available, subscribe to EPA's monthly TechDirect news service at: www.clu-in.org/techdirect/.
Funded by the Environmental Security Technology Certification Program (ESTCP), a pilot-scale, recirculating, anaerobic mulch bioreactor was installed in 2003 at the Altus Air Force Base (AFB) "Landfill 3" in Oklahoma to address a hotspot of chlorinated volatile organic compounds (VOCs) within a larger groundwater plume. [For more information, see the May 2007 issue of TNT.] The Air Force Center for Engineering and the Environment (AFCEE) and Altus AFB have since performed two enhancements, both of which involved injecting reagents directly into the bioreactor to improve performance. These enhancements have shown success in reducing chlorinated VOC concentrations within water entering the bioreactor matrix by up to 99% with reduced accumulation of dechlorination byproducts. However, results of the second enhancement are still being analyzed.
The first enhancement involved injecting emulsified vegetable oil (EVO) and a microbial bioaugmentation culture into the subsurface bioreactor in October 2006. The purpose was to replenish the soluble organic carbon content and improve degradation of the trichloroethene (TCE) dechlorination products, specifically dichloroethene (DCE) and vinyl chloride (VC). EVO was selected as the liquid organic substrate due to its relatively low cost (less than $2/lb of premixed emulsion) and persistence in the subsurface. From February 2004 to July 2006, the bioreactor yielded total chlorinated VOC efficiency of 75% to 96% and total TCE removal efficiency of 97% to > 99%. Following the 2006 bioenhancement, total chlorinated VOC removal efficiencies (measured in January and July 2007) were 99% and 66%, respectively, and TCE removal efficiencies were 98% and 99%, respectively. The lower total chlorinated VOC removal efficiency in July 2007 may have been due to an influx of new TCE mass into the bioreactor as a result of higher-than-normal precipitation and water table in June 2007.
In January 2010, the solar-powered submersible pump that recirculated contaminated groundwater through the bioreactor was replaced. The new Grundfos 11SQF2 submersible solar-powered pump recirculates groundwater at a rate of 2-4 gpm during peak sunlight hours and maintains an average flow rate of approximately 2.5 gpm each day.
The second enhancement was performed during a five-day period from May to June 2010. A combination of EVO and iron/sulfate amendments was injected into the bioreactor to supplement biotic VOC degradation by also enhancing abiotic degradation. Research suggested that this mixture of organic and inorganic amendments could stimulate production of reactive iron sulfide (FeS) minerals capable of degrading chlorinated VOCs abiotically through biogeochemical transformation. The objective of introducing iron and sulfate was to obtain a target FeS concentration in the bioreactor backfill of approximately 3,000 mg/kg, measured as acid volatile sulfide.
Design calculations for the iron and sulfate injection indicated that an FeS concentration of 3,000 mg/kg should abiotically reduce influent TCE concentrations by at least 70%. This calculation assumes an influent TCE concentration of 1,210 µg/L (based on July 2007 data), an average residence time of 7.5 days, and a conservative TCE degradation rate of 0.53 moles per day of TCE when exposed to 1.0 mole of FeS in contact with 1.0 liter of pore water.
Approximately 3,600 pounds of ferrous sulfate were mixed with 300 gallons of buffered EVO and 7,200 gallons of native groundwater were pumped from the nearby extraction trench sump. The mixture was pressure-injected into the subsurface bioreactor via four temporary, 4-foot-long injection screens driven to the bottom of the bioreactor, approximately 11 feet below ground surface (bgs) and about 5 feet below the water table.
The recirculation system was temporarily deactivated prior to the injection. Recirculation was then delayed for several weeks following injection to allow the EVO substrate to sorb to the bioreactor matrix. The delay also allowed the injected sulfate to be biologically reduced to hydrogen sulfide. The intended outcome was for the sulfide to react with ferrous iron to precipitate reactive FeS minerals within the bioreactor and immediately surrounding aquifer matrix.
Preliminary evaluation of groundwater quality data collected from October 2010 to May 2011 from monitoring wells screened within the bioreactor indicates that concentrations of TCE have remained below 5 µg/L, relative to influent concentrations of TCE as high as 1,200 µg/L. In May 2011, the average reduction in the concentration of cis-1,2-DCE within the bioreactor was 90% relative to the influent concentration, and average concentrations of VC relative to the influent concentration remained stable. These data potentially indicate that biogeochemical degradation may be occurring because abiotic degradation of TCE generally does not produce intermediate dechlorination compounds. Samples of bioreactor material are currently being analyzed for mineral content to evaluate the formation of iron sulfide minerals.
Similar to other anaerobic bioremediation applications, the Landfill 3 bioreactor's effectiveness is expected to depend on longevity of the organic substrate and maintenance of highly anaerobic conditions conducive to degradation of chlorinated VOCs. The 2010 EVO injection was designed to sustain the desired biogeochemical conditions for a minimum of 12-18 months–sufficient time to facilitate and sustain formation of reactive iron-sulfide minerals.
The cost of amendment injections totaled approximately $30,000, including material and shipping costs of $7,300 for the EVO product and $4,900 for the iron and sulfate amendment. Between January 2010 when the bioreactor recirculation pump was replaced and May 2011, approximately 450,000 gallons of water were recirculated through the bioreactor. The final data from this pilot-scale demonstration will be combined with results from AFCEE demonstration projects being conducted at other Air Force bases to assess whether amendment injection to enhance abiotic biogeochemical transformation of VOCs is a technically viable and cost-effective approach. AFCEE anticipates release of a final cost and performance report in early 2012.
Contributed by Doris Anders, Ph.D., U.S. Army Environmental Command, (doris.anders@us.army.mil), J. Seb Gillette, Ph.D., AFCEE (john.gillette.1@us.af.mil or 210-395-8440), John Hicks and Bruce Henry, Parsons (john.hicks@parsons.com or 303-764-1941) (bruce.henry@parsons.com or 303-764-1986)
EPA Analyzes Superfund Remedy Trends Over Recent Years
EPA's Office of Superfund Remediation and Technology Innovation reported in September 2010 that the Superfund remedial program continues to select a treatment component for nearly half of all contaminated site remedies involving source control. Based on information from fiscal year 2005 through 2008 records of decision (ROD), ROD amendments, and explanations of significant differences, approximately half of these treatment components involved in situ technologies. Soil vapor extraction, solidification/stabilization, multi-phase extraction, and in situ thermal treatment were the most frequently selected in situ technologies for source control, and solidification/stabilization was the most frequent ex situ technology.
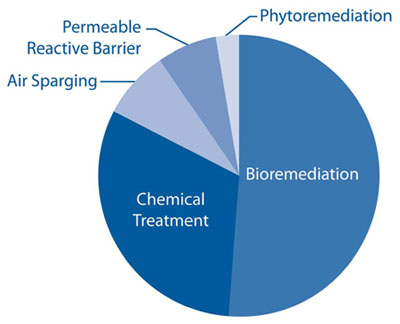
For groundwater treatment projects, the Superfund remedial program continued its upward trend in selecting remedies that are implemented in situ, which is currently about 30%. According to the 2005-2008 decision documents, one or more of five treatment technologies were involved in nearly 98% of the in situ remedial projects for contaminated groundwater (Figure 1). For more information about the cleanup trends and EPA observations, see the Superfund Remedy Report (13th edition, September 2010; EPA-542-R-10-004), available at www.clu-in.org/asr.
Sediment Cleanup Remedy for Lower Fox River Reaches 25% Construction Completion
Addressing sediment containing polychlorinated biphenyls (PCBs) in a 39-mile stretch of the Lower Fox River near Green Bay, WI, has involved an integrated approach of dredging, multiple cap designs, and natural recovery [see October 2008 TNT]. This approach has been used since 2008 to accommodate varying depths and concentrations of contaminants as well as restrictive site conditions such as in-water navigational structures, steep shorelines, and nearby commercial facilities. Project design calls for capping a total of 880 acres and dredging approximately 4 million yd3 of contaminated sediment, the largest sediment remediation project in the United States. Cleanup was achieved at one of the site’s five operable units (OUs) in 2009, and completion at another OU is expected later this year, based on a site-specific cleanup goal of 1 ppm and a surface weighted average concentration goal of 0.25 ppm.
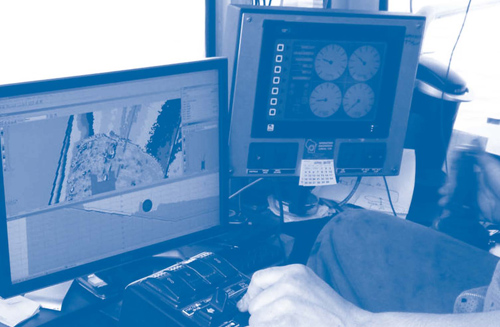
Since dredging began in 2004, EPA Region 5 and the Wisconsin Department of Natural Resources (WDNR) have worked with cleanup contractors to explore ways to streamline field operations and improve dredging efficiency. One significant improvement was the integration of a global positioning system (GPS) with the relatively small (2-foot) cutterhead used for high production dredging (Figure 2). Use of this precision tool helped assure dredging of the targeted sediment with PCB concentrations exceeding 1 ppm. Another improvement involved introduction of a supplemental, 8-inch hydraulic dredge equipped with a Vic-VacTM suction dredge head. Focusing this smaller dredging unit on the sediment that remained after cutterhead pass-through was found to be more efficient in dredging areas with thin layers of PCB-contaminated sediment overlaying hard-pan clay. To reduce use of petroleum products in the field and associated toxicity in the event of spills, vegetable oil-based hydraulic fluids are now used routinely in the dredging and auxiliary equipment.
Implementation of these methods led to larger dredging volumes of the targeted sediment; approximately 620,000 yd3 were dredged in 2009 and 740,000 yd3 in 2010. Sediment with PCB concentrations exceeding the 1 ppm threshold but less than 50 ppm were transferred to a hazardous waste management facility located 30 miles from the site. A relatively small sediment volume (less than 5% of the total) with PCB concentrations of 50 ppm or more will be transferred to a TSCA-approved disposal facility (regulated by EPA under the Toxic Substances Control Act) located several hundred miles away in Michigan.
Cap construction based on three primary design configurations has been completed on 290 acres of contaminated sediment, about 33% of the total required. In OU1, where capping was completed in 2009, a total of 221 acres were capped with an average 12-inch-thick layer of mixed sand and gravel. At an additional 37 acres of OU1 where dredging had occurred but residual contamination remained, selected areas were covered with 3-9 inches of clean sand.
Long-term monitoring of areas achieving the cleanup goals began in early 2010, with a focus on quantifying risk reduction in fish and surface water as well as sediment. Monitoring results at OU1 show that PCB concentrations in tissue of walleye as the primary ecological indicator species had decreased 73% when compared to the 1990-2003 baseline, at which time 3 of 79 walleye (4%) exhibited concentrations below 0.05 ppm. In 2010, 24 of 27 walleye (89%) from OU1 had concentrations less than 0.05 ppm, resulting in an average PCB concentration of 0.03 ppm.
Monthly analysis of the OU1 water column during 2010 showed a PCB concentration substantially lower than pre-remedial (1998) concentrations. Even greater PCB reductions were observed when compared to the 5-9 ng/L range measured in 2007, when dredging had already begun; as with most contaminated sediment dredging projects, the contaminant concentrations temporarily increased due to water turbulence. Additionally, OU1 sediment surface samples indicated an average PCB concentration of 0.25 ppm, substantially lower than the pre-remedial (1998) concentrations.
Similar monitoring steps will be conducted at each capped area approximately two years and four years after construction completion and every five years thereafter until cleanup goals are achieved. Based on the past three years of progress, EPA Region 5 anticipates completion of cap construction and sediment dredging in 2017. To date, project costs total over $300 million, including dredging, dewatering, waste disposal, and cap installation.
Contributed by Jim Hahnenberg, EPA Region 5 (hahnenberg.james@epa.gov or 312-353-4213)
EZVI Injection Field Test Leads to Pilot-Scale Application
Testing and monitoring of emulsified zero-valent ironTM (EZVI) injections were conducted at Cape Canaveral Air Force Station's Launch Complex 34, FL, from 2002 to 2005 to evaluate the technology’s efficacy in enhancing reductive dechlorination by increased dissolution of dense nonaqueous-phase liquid (DNAPL) [see September 2005 TNT]. Results from the small field test showed an average 71% reduction of TCE concentrations in groundwater wells (at a depth of approximately 8 meters bgs) and a 56% reduction in mass flux. Later in 2005, findings from the field test were used to begin a pilot-scale demonstration at the Marine Corps Recruit Depot in Parris Island, SC, with a focus on differentiating the technology's degradation mechanisms and improving substrate delivery methods.
As originally developed by the National Aeronautics and Space Administration (NASA), EZVI consists of food-grade surfactant, biodegradable vegetable oil, water, and nano- or micro-scale iron that are mixed onsite. The technology relies on presence of the water and oil to increase contact between the ZVI particles and DNAPL and consequently dissolve chlorinated VOCs. This increased dissolution of sorbed or trapped DNAPL allows enhanced reductive dechlorination to proceed. In addition, the ZVI's vegetable oil and surfactant components serve as long-term electron donors for anaerobic biodegradation.
The pilot-scale demonstration was conducted at the Depot's Site 45, where earlier investigations revealed the presence of source-zone tetrachloroethene (PCE) DNAPL. Concentrations of the chlorinated daughter products TCE, cis-DCE, and VC in the same wells were as high as 160 mg/L, 180 mg/L, and 13 mg/L, respectively.
The two EZVI delivery methods found to be most effective in the Cape Canaveral field test were evaluated in two side-by-side plots at Site 45: pneumatic injection using nitrogen gas to fracture the subsurface, and direct injection using a direct-push rig. In the pneumatic injection plot, which encompassed 51 m3, a total of 2,180 liters of EZVI containing 225 kg of iron, 856 kg of corn oil, and 22.5 kg of surfactant were injected to treat an estimated 38 kg of VOCs (of which roughly 38% is attributed to DNAPL). The EZVI was injected using a bottom-up injection procedure in eight locations between 2.13 and 5.64 meters bgs. Approximately 121 liters of EZVI "daylighted" by migrating up the area's former investigation borings to the ground surface.
In the adjacent 11-m3 plot, 572 liters of EZVI containing 59 kg of iron, 225 kg of corn oil, and 5.9 kg of surfactant were directly injected into four locations at depths of 1.83-3.66 meters, to treat an estimated 155 g of VOCs. Approximately 19 liters of injected EZVI daylighted during injection. Both delivery methods involved EZVI containing iron in the form of nano-scale particles.
Based on visual observation of soil cores at 17 test plot locations, pneumatic injection achieved a 2.1-meter radius of influence (ROI), while direct injection reached a smaller ROI of 0.89 meters. The cores also suggested that EZVI in both plots was not as evenly distributed throughout the target treatment interval as desired, likely due to viscous fingering of the DNAPL or preferential flow paths. Results suggest that pneumatic injection may be well suited to a relatively large source zone (with a high volume of contaminants), while direct injection may be better suited to a smaller source zone.
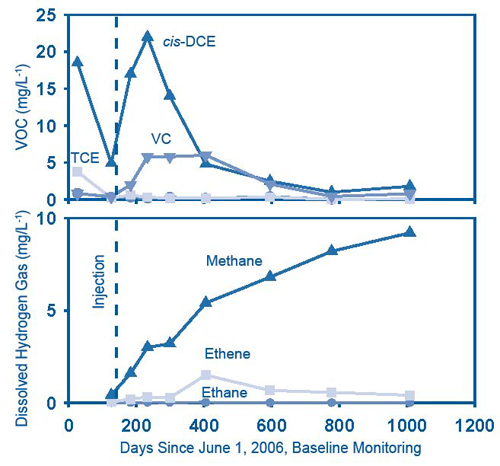
Sampling of downgradient wells 2.5 years after injection indicated that decreased PCE and TCE concentrations highly correlated to increases in degradation products including ethene (Figure 3). Nine test-plot soil cores collected from ground surface to a depth of 6.1 meters bgs were used to evaluate VOC mass distribution, and measurements of soil porosity, bulk density, and the fraction of organic carbon were performed on selected soil samples to refine the VOC mass estimates. By March 2009, total VOC mass in the pneumatic injection plot had decreased approximately 86%, from the estimated 38 kg to 5 kg. Based on soil and groundwater sample analyses, treatment resulted in an estimated 63% reduction in the sorbed and dissolved phases and 93% reduction in the PCE DNAPL mass. Integral pump tests in downgradient wells and groundwater sampling along multilevel transects for the pneumatic injection pilot showed that mass flux decreased more than 85% for both PCE and TCE and significantly increased (145-2,271%) for ethene.
VOC degradation via biological processes was suggested by significant increases in dissolved sulfide, volatile fatty acids, and total organic carbon. Concurrently, significant decreases in dissolved sulfate and pH were observed. Dissolved oxygen levels remained below 2 mg/L prior to and after injection. Although microbial analysis was not performed for the source area, earlier study at another Site 45 groundwater plume area with similar lithology and hydrology revealed the presence of microbes (Dehalococcoides sp.) known to degrade cis-DCE and VC to ethene. A more recent (2010) microcosm study conducted jointly by Nankai University, Rice University, and Carnegie Mellon University shows no deleterious effect of nano-scale ZVI on the abundance of bacterial species such as Dehalococcoides.
Ongoing work includes evaluating transformation and mobility of the injected nano-scale ZVI through analysis of solids sampled from monitoring wells and from long-term monitoring of soil cores. A variety of analytical methods such as x-ray diffraction and x-ray absorption spectroscopy are being used to determine the presence of associated corrosion products, as an indicator of the material's toxicity to ecosystems.
Innovative Examples
EPA's Technology Innovation and Field Services Division continues to build a series of databases with project profiles on topics such as alternative landfill covers, phytotechnology, chemical oxidation, nanotechnology, and Triad. Access the online site-specific profiles at: www.clu-in.org/databases/.
Purchasing costs for the nano-scale iron used at Site 45 totaled approximately $14,000, at a unit cost of $28/pound from a Japanese vendor. Additional detail about cost and other aspects of the demonstration, which was funded by EPA and the U.S. Department of Defense ESTCP, is available in the September 2010 ESTCP Cost and Performance Report: Emulsified Zero-Valent Nano-Scale Iron Treatment of Chlorinated Solvent DNAPL Source Areas (ER-200431). The report includes a cost model and description of potential cost drivers for other sites, along with a summary of implementation issues, advantages, and limitations of the technology.
Contributed by Chunming Su, Ph.D., EPA National Risk Management Research Laboratory (su.chunming@epa.gov or 580-436-8638) and Jacqueline Quinn, NASA Kennedy Space Center (jacqueline.w.quinn@nasa.gov or 321-867-8410)
