![]() A newsletter about soil, sediment, and groundwater characterization and remediation technologies
A newsletter about soil, sediment, and groundwater characterization and remediation technologies
This issue of Technology News and Trends highlights innovative approaches for addressing contaminated sediment sites. Elements of these approaches include sediment dewatering through use of geotextile containers, designed armor stone layers in caps to withstand harsh surface and subsurface conditions, new models to predict navigational vessel impacts on cap performance, and placement of caps in very thin lifts over soft sediments.
Innovative Dredging Technology Accelerates Removal of Residual Contamination in Ashtabula River
CLU-IN Resources
CLU-IN’s web page on sediment remediation provides key technical resources on related capping, dredging, and monitored natural attenuation issues. The web page also provides important guidance documents and summaries of large-scale projects developed by organizations such as EPA's Great Lakes National Program Office, the U.S. Army Corps of Engineers, and the U.S. Department of Defense. Visit the sediments page at http:/www.cluin.org by clicking on the "Remediation" tab and the "Issue Areas" subtab.
The U.S. EPA's Great Lakes National Program Office (GLNPO) and their non-federal sponsor, the Ashtabula City Port Authority, along with the State of Ohio, the U.S. Army Corps of Engineers (USACE), and a consortium of private companies collaborated to design and implement an innovative approach for addressing extensive sediment contamination in a portion of the Ashtabula River near Lake Erie. The approach employed a linked system for hydraulic dredging, an aboveground, double-walled pipeline for sediment slurry transfer, and containment of the transported contaminated sediment in "dewatering tubes" at a newly constructed landfill. Over 13 months, the system remediated approximately 500,000 yd3 of sediment containing 25,000 pounds of polychlorinated biphenyls (PCBs), along with heavy metals, chlorinated organics, uranium, radium, and thorium.
In 1985, the Ashtabula River was designated a Great Lakes area of concern (AOC). Extensive mapping of AOC sediment characteristics began in 1990. Site investigations indicated that an industrial area along the Fields Brook tributary served as the primary source of river contamination. Past industrial activities included foundries and chemical plants, tanneries, and World War II weapons production. In 2003, under direction of U.S. EPA Region 5's Superfund Program remedial work on Fields Brook was completed from the headwaters of the brook to its confluence with the Ashtabula River. Additional source control work is underway.
Since 1962, the USACE had been unable to complete routine navigation dredging of a 1.4-mile stretch of the federally authorized navigation channel due to the presence of highly contaminated sediments. Although dredging in the navigation channel was authorized to a depth of 16 feet or more, much of this river stretch experienced restricted navigation depth as shallow as 0-2 feet. Additionally, fish consumption advisories have been posted in the lower two miles of the river since 1983. Average PCB concentrations measured in the sediment were 7.5 mg/kg, with a maximum concentration of 660 mg/kg. Targeted sediment contained approximately 150,000 yd3 of TSCA-regulated material.
To address the sediment contamination and stakeholder goals, federal and state agencies, local organizations, and private stakeholders formed the Ashtabula River Partnership in 1994 to comprehensively address the river's environmental and navigational problems. Between 1994 and 2004, the USACE led the site investigation, alternatives analysis, and preliminary design work (including two value engineering studies) to derive a proposed dredging and disposal remedy for the river. A primary recommendation from the value engineering studies was to use a single, project-specific landfill to confine both TSCA-regulated and non-TSCA regulated materials.
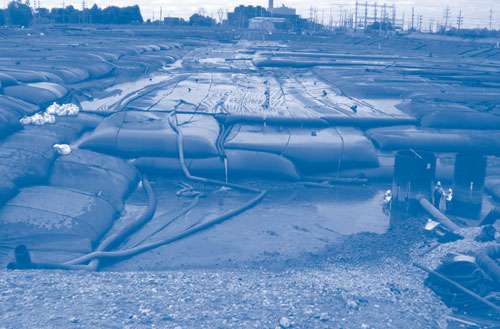
In April 2004, the Ashtabula City Port Authority, with the support of the Ashtabula River Partnership, submitted a request to the GLNPO requesting funds under the newly authorized Great Lakes Legacy Act (GLLA). After extended technical, legal, and financial discussions, active remediation on the $58 million river project began in 2006, with the GLLA providing $29 million in funding. The final design called for hydraulic excavation of sediments; hydraulic transport of the dredged slurry to the landfill through a 2.5-mile long, double-walled pipeline; dewatering of the sediment slurry using geotubes; and treatment of the water through a 5,000-gpm water treatment plant. Dewatering was designed to occur at the 1,000,000-yd3 TSCA-permitted landfill, with geo-textile tubes (geotubes) left in place for final disposal (Figure 1).
Construction of the landfill, pipeline, and water treatment plant commenced in May 2006 and concluded in September 2006, at which time full-scale dredging operations began. Initial dredging operations were conducted using a 12-inch, 750-hp, hydraulic cutterhead dredge to remove sediment at a depth of 0-20 feet below water surface. The dredge operated at a rate of approximately 3,800-4,200 gpm and produced a slurry with 6-15% total solids by weight. Dredged material consisted of mostly fine-grained sediment, which was pumped through a 12-inch, double-walled, HDPE piping system installed along the Fields Brook corridor. Three 500-hp booster pumps were used to maintain a consistent flow along the entire length of the pipeline, which involved a 60-foot vertical rise between the river and landfill.
At the landfill, the sediment slurry was pumped into geotubes that were approximately 300 feet long and 75 feet in diameter. As slurry moved into each tube, a polymer was added to increase coagulation of sediment particles. Coagulated particles remained inside the geotubes while slurry water exited by gravity through pores of the geotube's woven material. Filled tubes were allowed to air dry for approximately 15 days in order to achieve a solids content of approximately 40% before additional tubes were placed on them. The 13.5-acre TSCA-permitted landfill was constructed with two 60-mil synthetic liners, a geosynthetic clay liner, and several drainage layers along with a leachate collection system.
Water exiting each geotube entered the leachate collection systems and was pumped to a nearby water treatment system consisting of Lamella® gravity settlers, sand filters, and activated carbon filters. The water treatment process was designed to meet discharge limits of 0.001 µg/L PCBs, 0.16 ng/L mercury, and 10 mg/L total suspended solids in the water prior to discharge to the river.
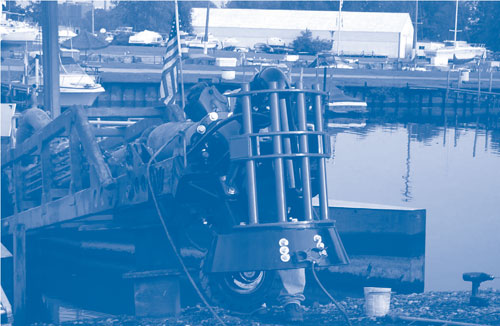
In June 2007, operations integrated a second but smaller (8-inch) hydraulic dredge equipped with an innovative Vic-Vac™ suction dredge-head (Figure 2). The 8-inch dredge operated in parallel with the 12-inch dredge, with both simultaneously discharging to the double-walled pipeline. By operating in parallel, the 12-inch dredge could focus on high production dredging that generated thicker cuts, while the 8-inch dredge focused on cleanup dredging that generated thin residual sediment layers. Typically, cleanup dredging results in hydraulic slurries with just 1-2% percent solids, which can present problems with dewatering and water treatment. By operating parallel dredges and combining the slurry streams, however, operations were able to maintain a consistent and reasonably high solids content (8-15%) in the combined slurry while performing cleanup operations specifically targeted at reducing residual contamination. The 8-inch dredge operated at an average production rate of approximately 1,000 gpm, and the 12-inch dredge operated at an average rate of 3,500 gpm. Cleanup dredging was performed on approximately 10 of the site’s total 30 acres where underlying bedrock prevented overdredging of contaminated sediments.
Previous experience at this and other sites suggested that significant amounts of residual contamination would remain in these dredged areas. Confirmation sampling after dredging indicated, however, that in areas where the Vic-Vac was used, the surface-weighted average concentration was 0.1 mg/kg total PCBs, well below the long-term cleanup goal. Several areas required 2-3 dredging passes with the Vic-Vac in order to achieve the long-term cleanup goal of 0.25 ppm PCBs.
Construction and operational costs for hydraulic dredging, dewatering, transfer, and disposal of the sediment totaled approximately $58 million. In accordance with GLLA provisions, GLLA funds covered 50% of the cost and the State provided an additional $7 million; the remaining $22 million was paid by the consortium of private companies.
A total of 25,000 pounds of PCBs have been removed from the river, and commercial and recreational vessels no longer are restricted from any portions of the river. The GLNPO continues to work with the Port Authority, State, and the private companies to implement a post-dredging monitoring plan, including evaluation of fish-tissue PCB concentrations. Project partners also are developing and initiating implementation of a habitat mitigation plan to restore 3-5 acres of shallow water habitat.
Contributed by Scott Cieniawski, EPA Region 5 (cieniawski.scott@epa.gov or 312-353-9184) and Natalie Farber, OH EPA (natalie.farber@epa.state.oh.us or 614-644-2143)
39-Mile Dredging/Capping Approach Used to Treat Fox River PCBs
The Lower Fox River in Wisconsin contains approximately 8 million yd3 of PCB-contaminated sediment targeted for active remediation. The site's records of decision (RODs) were amended in 2007 and 2008 to specify dredging of nearly 4 million yd3 of sediment with high concentrations of PCBs, followed by in situ capping of approximately 560 acres of sediment comprising operable units (OUs) 1 through 4. The cap design included development of an innovative method for determining an armor stone dimension sufficient to withstand propeller wash from frequent recreational vessel traffic.
The site extends 39 miles from the outlet of Lake Winnebago into Green Bay. Contamination is found primarily in the first six miles (OU1) and the last 20 miles (OU3 and OU4) of the river, reaching PCB sediment concentrations as high as 3,000 ppm. Contaminated sediment extends to depths of up to 13 feet. Commercial shipping is confined to the last 3.5 miles of OU4, which ends at the mouth of Green Bay. Sediment distribution in the middle 13 miles (OU2) is patchy with intervening bedrock exposures. OU2 contains the site's greatest elevation drop and consequently the majority of the river's locks and dams. OU5 comprises the entire bay, but dredging and capping are anticipated only near the river mouth; monitored natural recovery was selected as the remedy for most of OU2 and OU5.
Based on experience in OU1, dredging did not always remove all sediment above the site-specific cleanup goal of 1 ppm. This goal and the surface weighted-average concentration goal of 0.25 ppm can only be met with a combined approach of dredging, capping, and sand covers. Dredging could not be used in areas with in-water infrastructure such as bulkhead walls or docks, near utility crossings associated with commercial facilities, or near shorelines with steep banks. As a result, a capping approach using four designs (differing in stone and/or sand components) was used to contain residual contamination and non-dredged areas.
Design criteria for dredging included maximum horizontal/vertical slopes of 3:1 for submerged areas and 5:1 for shorelines with nearby infrastructure. A typical dredge management unit covers approximately 6 acres, which involves approximately 1 week of dredging per unit. Prior to full-scale dredging operations, models were used to develop final plans.
Dredging was initiated in OU1 in 2004 followed by the placement of sand covers in areas where residual PCB concentrations remained above 5 ppm; cover thickness ranged from 3 to 6 inches, depending on PCB concentrations. Sand covers also were placed on undredged areas with lower PCB concentrations; caps composed of sand and armor stone were placed over higher PCB concentrations. To date, more than 370,000 yd3 of PCB-contaminated sediment have been removed from OU1, of which approximately 8,000 yd3 contained PCB concentrations above 50 ppm and were classified as TSCA in situ sediment. The sediments were disposed at local state-regulated landfills. Water generated by dredging, sand recovery, and dewatering is treated through bag filters, sand filtration, and granulated activated carbon prior to river discharge. Air monitoring to date has shown no exceedance of thresholds for particulates or PCBs.
Similar operations will continue downstream (mainly in OUs 3 through 4) from 2009 to 2017. Hydraulic dredges and in-water pipelines are used to remove and transport contaminated sediment to a staging area where sand fractions will be washed or otherwise treated for possible beneficial onsite or offsite use.
Engineered caps will be placed at locations where the final cap height allows for at least 3 feet of water and at least 2 feet below the authorized navigational water depth. In order to ensure caps will have long-term stability and effectively contain PCBs, the following conditions were evaluated during cap design:
- Frazil ice, particularly in areas of turbulent waters downstream of dams or possible high water velocities due to ice dams;
- High flows from tributary flooding; and
- Combinations of river flow, due to seiche effects or lake level changes.
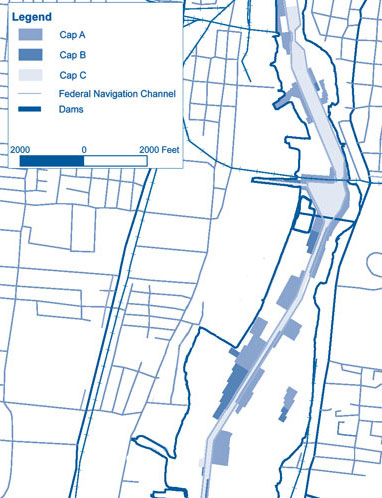
To further ensure effective caps, different cap designs will be employed for different river conditions. In navigable areas, nearshore areas, or where sediment contains PCB concentrations exceeding 50 ppm, the armor consists of a 33-inch layer of sand, gravel, and quarry spall. For design and construction purposes, this cap type was designated as a "Cap C." (Figure 3). In other areas, the cap consists of 13 inches of sand and gravel (Cap A) covering approximately 200 acres, or 16 inches of sand and gravel (Cap B) covering approximately 70 acres. An estimated 25 additional acres of shoreline caps will be constructed using larger armor stone to be determined case by case. The areal extent of each cap and total acreage of cap types is subject to ongoing refinement. Other areas having sediment profiles with PCB concentrations below 2 ppm or in thin deposits (6 inches or less) are covered with 6 inches of clean sand imported from local sand and gravel pits. Shortly after placement, the thickness of each cap layer is verified to specified engineering standards.
Design of the cap for the navigation channel of OU4 involved site-specific models considering erosive forces such as wave-induced currents, river flows, ice scour, seiche, and vessel propeller wash. This "JETWASH" model is similar to that recommended by the U.S. EPA and USACE but includes additive velocities accounting for the propeller shaft pitch and reflection relative to the river bottom, which are critical factors for recreational boats. The model includes a momentum-based approach to analyze stability of a bed armoring particle that is subjected to time-dependent propeller wash velocity fluctuations typical of recreational vessels. Due to the wide variety of recreational vessels and modes of operation used in the Fox River, the propwash model relied on Monte Carlo simulations using 2,500 parameter combinations for water depths of 3, 5, 7, and 10 feet each. In addition, two-dimensional hydrodynamic models were evaluated for OUs 1, 3, 4, and 5 to predict bottom shear stresses during maximum flow anticipated in a 100-year flood event. USACE empirical models were used to predict characteristic vessel waves. To consider potential impacts from propwash, a Monte Carlo statistical model was applied, incorporating:
- Capping costs and stone size;
- Magnitude of likely damage if movement occurs; and
- Degree to which a cap can "self-heal" to re-cover areas where cap materials may have moved due to propwash or other influences such as vessel anchors.
Finally, if regularly scheduled or event-triggered monitoring indicates that caps have been eroded or otherwise adversely impacted, the caps will be repaired as necessary to provide continued containment.
Institutional controls currently include fish consumption advisories throughout the site, establishment of no-wake areas in OUs 3 and 4, and limited public access to waters undergoing active dredging or cap construction. Monitoring during active dredging and cap construction includes routine geophysical surveys and core sampling 2 and 4 years after the initial post-construction survey and every 5 years thereafter. Details of this monitoring plan are being developed during the design phase for OUs 2-5. Long-term monitoring also will include testing of cap integrity and performance with respect to contaminant containment, and analytical sampling of water and fish tissue at least every 5 years to evaluate environmental results.
Approximately 30 acres of caps have been installed to date. Following dredging and cap construction, additional time will be needed for natural recovery, which will result in additional contaminant reductions meeting other cleanup goals. In OU 3, for example, an estimated nine years of natural recovery are needed to reduce PCB fish tissue concentrations to 0.049 ppm, the threshold for unlimited walleye consumption. Construction completion is scheduled for 2018.
Contributed by Jim Hahnenberg, EPA Region 5 (hahnenberg.james@epa.gov or 312-353-4213)
Pilot Study Shows Effective Cap Design for PCB-Contaminated Sediment
A 1-acre pilot study was used to evaluate multiple cap designs at Silver Lake in Pittsfield, MA, prior to construction of a full-scale cap over the entire 26-acre lake bottom. Sediment in Silver Lake is contaminated with PCBs and other chemicals from past discharges of process water and wastewater from the nearby General Electric (GE) facility. Monitoring indicated that the pilot caps provided an effective barrier to upward transport of PCBs from the underlying sediment. Use of geosynthetic materials, however, did not appear to improve cap performance significantly.
Between early October and late November 2006, the pilot study was conducted at three contiguous 45-ft by 300-ft sub-areas. An isolation layer was placed directly on the soft sediment in one sub-area (Figure 4). This layer contained 2.5 parts pond sand (by volume) mixed with 1 part topsoil using conventional earth-moving equipment to achieve approximately 1% total organic carbon (TOC) in the dry mix. A custom-made, barge-mounted, spreader box broadcasted slurried material in thin 1- to 2-inch lifts to minimize the potential for resuspension and mixing of the underlying sediments. The thin lifts also help avoid settlement or slope failure resulting from the relatively low-strength, highly-compressibile sediments and steep slope of the lake floor near the shore. The lifts were broadcasted until a depth of 12-14 inches was achieved.
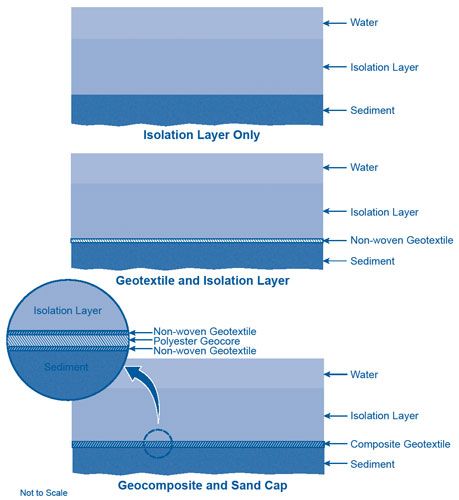
The second sub-area was covered with a non-woven geotextile before subsequent placement of the same isolation materal. Three 15-ft wide by 300-foot long rolls of Mirafi 180N non-woven geotextile fabric were unrolled from a barge. The adjacent edges were sewn together to form one contiguous piece (with about 2-foot overlap at each seam) and anchored temporarily to the banks with sandbags attached in an approximate 20-ft grid. Due to puckering of the emplaced geotextile—likely resulting from its buoyancy—more sandbags were added to ensure that the fabric would lay flat over the sediment. A fourth roll was later placed using rebar to add structural support to the geotextile and maintain the width of the fabric during placement to fully cover the sub-area.
The third sub-area was covered with a composite geotextile mat before placement of the isolation layer. The composite geotextile was constructed of two layers of a non-woven geotextile sewn together and filled with a thin layer (less than 1 inch) of a sand/organo-clay mix. The mix had a TOC similar to the isolation layer. This composite configuration was prepared in nine rolls (about 15-feet wide by 100-feet long) that were sewn together and unrolled from the barge similar to the non-woven geotextile cap. Puckering during installation led to the addition of rebar, for structural support to maintain the full width of the fabric.
Armor stone was installed along the shoreline to protect all three caps from erosion due to wind-induced waves. The armor consisted of riprap placed over a woven geotextile above and below the mean water surface elevation. A gravel layer was placed over the armor stone below the water line to improve habitat for aquatic species.
The thickness of the three pilot caps was measured using a combination of acoustic profiling, probing, and coring. The thickness of all three caps was found to be fairly uniform, averaging 12 to 14 inches.
Physical survey plates and vibrating wire settlement cells were used to measure sediment settlement during, immediately after, and six months after construction of the caps. The results generally indicate a relatively uniform, slow rate of settlement and compaction of the underlying native sediment, averaging 11-12 inches over the first nine months. The majority of settlement occurred during placement of the isolation layer and appeared to be complete within two to six months of cap placement. Use of geosynthetic layers did not appear to create any variations in the extent of settlement. Although settlement rates greater than the target of 1 inch/day were occasionally measured, there was no indication of sediment instability or other deleterious effects on cap performance. Coring and sediment profile imaging showed some mixing of the sediment and isolation layer material in the isolation layer-only cap, but mixing appeared to be limited to the lower 2 inches of material.
PCB concentrations in sample cores were low (non-detect to 14 mg/kg) relative to underlying sediments (25.2 to 178 mg/kg), with about 70% of the detections less than 1 mg/kg. Collectively, the PCB distribution in the post-construction cores suggests that isolation layer materials, when placed in thin lifts, caused only limited disturbance to or mixing with the underlying sediments. No indication of upward transport of PCBs through the cap material was noted. A reduction in overall TOC in the isolation layer before and after placement was observed; however, the average TOC was at or approaching the post-construction target level (approximately 0.5%).
PCB concentrations detected in the Silver Lake water column were lower during implementation of the pilot study than those prior to the study, indicating that little or no re-suspension of existing sediments occurred as a result of cap placement. Turbidity increased while the isolation material was broadcasted, but it returned to pre-construction levels within a month. A portion of the decrease in PCBs in the surface water may be attributable to sorption of PCBs to suspended particles when turbidity was increased.
The study results show that the sand cap amended with organic carbon installed in thin lifts produced minimal disturbance to the underlying sediments of Silver Lake and provides an effective barrier to PCB-contaminated sediment. Addition of geosynthetic materials did not appear to benefit construction significantly. General Electric is now designing a full-scale cap for Silver Lake based on the conceptual cap design of the pilot study.
Contributed by Susan Svirsky, U.S. EPA Region 1 (svirsky.susan@epa.gov or 617-918-1434)
