![]() A newsletter about soil, sediment, and groundwater characterization and remediation technologies
A newsletter about soil, sediment, and groundwater characterization and remediation technologies
This issue of Technology News and Trends highlights accelerated remediation of contaminant source areas containing dense nonaqueous phase liquid (DNAPL). Treatment typically involves conversion of contaminants, most commonly trichloroethene, from the nonaqueous phase to the dissolved phase where degradation occurs more readily through chemical or biological processes.
Dual-Reagent ISCO "Fast-Tracks" Cleanup of Orlando Brownfield
CLU-IN Resources
Dense Nonaqueous Phase Liquids is one of several Contaminant Focus areas of the U.S. Environmental Protection Agency (EPA) CLU-IN web host www.clu-in.org/contaminantfocus/. Information includes introductory discussion and additional web links for DNAPL policy and guidance, chemistry and behavior, environmental occurrence, toxicology, and treatment technologies.
The City of Orlando initiated a three-phase plan in the summer of 2007 to accelerate remediation of VOC-contaminated groundwater. Contamination was found beneath a former industrial site scheduled to reopen in 2010 as the city's events center. The first phase of the plan employed in situ chemical oxidation (ISCO) with catalyzed hydrogen peroxide (CHP) to target the suspected contaminant source area, located directly below the center's proposed athletic arena. The second phase involved additional ISCO using sodium permanganate to target residual contaminants, and the third phase focused on offsite disposal of shallow impacted soil. Sequentially applying two oxidants, rather than combining single-oxidant ISCO with a time-intensive polishing technology such as bioremediation, met the project's cleanup goals within nine months. To meet a tight schedule calling for 2008 startup of building construction, field work was guided by daily rounds of injector and monitoring well sampling to optimize reagent and catalyst dosing. Frequent measurements of off-gases and degradation end products also were made to quickly determine when chemical oxidation was complete.
An investigation in early 2007 confirmed source-area tetrachloroethene (PCE) in concentrations reaching 14,600 µg/L in groundwater above a clay-confining layer 40 feet below ground surface (bgs). Concentrations of PCE degradation products included 57 µg/L of trichloroethene (TCE) and 98 µg/L of cis-1,2-dichloroethene (DCE) without detectable levels of vinyl chloride. The presence of DNAPL was suspected due to the high PCE concentrations in sand and silt zones immediately on top of the area's dense clay aquitard. Remediation goals were set at the Florida groundwater cleanup target levels (CTLs) of 3 µg/L for PCE and TCE and 70 µg/L for DCE.
Shallow soil at depths of 2-4 feet bgs also was contaminated in two discrete areas near a concrete pad with an underlying sewer from past operation of a garage and machine shop. The highest identified PCE concentration in soil at these areas was 0.49 mg/kg, which exceeded the 0.03 mg/kg CTL for leachability.
In early November 2007, field preparations for ISCO began by installing 72 injection wells spaced on 20-foot centers in an 80- by 130-foot area of concern (AOC) under the proposed arena. Each well extended to one of three intervals between 10 and 40 feet bgs. Shallow and deep nested injectors were screened from 15 to 20 feet and 35 to 40 feet bgs, respectively, and interspersed intermediate-depth zone injectors were screened at 25 to 30 feet bgs. Use of a direct-push (DP) instead of conventional drilling rig allowed for construction of the well network in two weeks. The grout seals were allowed to cure for two weeks.
CHP was selected as the primary oxidant due to its efficiency in destroying DNAPL and sorbed-phase contamination. The first-phase injection was conducted in January 2008 using two trailers connected by chemical hoses to inject low-pressure CHP solution into the full array of injection wells. Using a top-down injection approach, each injection rig initially deployed four injectors to fully blanket the AOC.
A photoionization detector (PID) and multi-gas meter were used to measure VOCs, oxygen, and carbon dioxide in the well headspace as indicators of treatment progress. PID readings from four monitoring wells in the source area showed an initial VOC spike related to contaminant desorption from the aquifer matrix, followed by subsequent VOC destruction to non-detectable levels over the remainder of treatment. CHP injection was terminated after 23 days, when PID and other in situ data indicated completed chemical oxidation. Residual catalyzed peroxide from the 85,000-gallon injection was allowed to degrade for another week before the second injection phase began.
Sodium permanganate was selected as the secondary reagent due to its ability to treat residual contaminants that slowly diffuse out of the fine-grained aquifer matrix after the peroxide had removed bulk contamination. In early February 2008, approximately 21,000 gallons of 4% sodium permanganate solution was injected through the same well network over 7 days. The volume was anticipated to again blanket the full AOC. Injection and post-injection monitoring included groundwater sampling for visual analysis to ensure uniform permanganate distribution. Permanganate in its characteristic purple color was found throughout the treatment area.
In the third phase of remediation during late February, approximately 94 tons (1,800 ft3) of surface soil were excavated to a depth of 4 feet near the concrete pad. The two-day excavation targeted all vadose zone soil documented to contain detectable VOCs during earlier delineation of the AOC. It also revealed a PVC pipe connected to a former floor drain system, which contained residual sludge above the source area. Elevated PID readings in the pipe vicinity suggested this jointed sewer was the source of solvent discharge. Following extraction of the pipe and associated bedding, the concrete pad was removed and the area was backfilled. Confirmatory sampling in early March did not detect PCE in soil surrounding the excavated area.
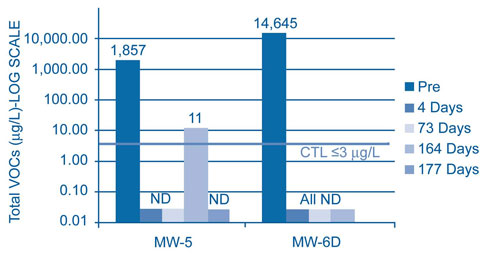
Groundwater was sampled in five treatment-area monitoring wells beginning four days after the permanganate injection and in mid- April and mid-July. Results indicated that total VOCs immediately decreased after the first injection (Figure 1) and remained below the CTLs except at one well (MW-5) close to the former pad and excavation area. The increase in PCE concentrations at MW-5 prompted injection 7 days later of 150 additional pounds of sodium permanganate via shallow injectors within 20 feet of the well. Confirmatory sampling in early August showed a PCE concentration below 1.0 µg/L in MW-5, which supported earlier suspicion that the observed VOC rebound was caused by the preceding excavation activities.
July and subsequent monitoring events in five wells within the treatment area showed a total VOC concentration of less than 3 µg/L, a 99.98% decrease from maximum pre-treatment levels. More recent investigations by the Florida Department of Transportation in an adjacent offsite area documented a presence of permanganate that likely continues to polish onsite groundwater and groundwater downgradient of the AOC.
The injectors and monitoring wells were abandoned shortly after MW-5 confirmation sampling and when all treatment-area wells exhibited non-detectable levels of PCE, within 290 days after the city executed the cleanup contract. Field work was completed in 101 days, and the remaining project time involved regulatory review and post-treatment monitoring. Costs totaled $596,000 for remediation (approximately $34/yd3) and $85,395 for soil and groundwater confirmatory sampling during and after the injections. Building construction began on schedule in July 2008 for opening of the city's new events center this October.
Contributed by Alan Oyler, Orlando Department of Public Works (alan.oyler@cityoforlando.net or 407-246-3623), Dan Bryant, Geo-Cleanse International Inc., (dbryant@geocleanse.com or 732-970-6696), and Ed Kellar, MACTEC Engineering and Consulting Inc. (emkellar@mactec.com or 352-332-3318)
In Situ Thermal Desorption Minimizes Cleanup Duration at Dunn Field BRAC Site
Full-scale in situ thermal desorption (ISTD) was initiated in 2008 for areas of Dunn Field at the Memphis Defense Depot Superfund site to destroy chlorinated VOCs (CVOCs). ISTD was selected to replace soil vapor extraction (SVE) in the top 30 feet of soil, a clay-rich loess, after SVE pilot testing suggested that its exclusive use in the loess could take up to 235 years to reach remediation goals (RGs). Thorough delineation of the CVOC hotspots minimized the areas needing treatment, which lowered ISTD costs while significantly reducing the overall cleanup cost and duration.
The Memphis Depot closed in 1997 under the Base Realignment and Closure Act (BRAC) after approximately 55 years of use for military material distribution/storage and maintenance services. Upon closing, the 64-acre Dunn Field housed multiple areas used for mineral and waste storage and disposal. The underlying stratigraphy consists of the relatively low-permeability loess which grades, with depth, to a high permeability fluvial unit consisting of sand, silt, and gravel. Groundwater depth is approximately 75 feet bgs.
A 2004 record of decision (ROD) determined that 41 acres of the site were suitable for unrestricted use. The remaining acreage contained varying degrees of CVOC contamination, including concentrations high enough to suggest the presence of NAPL. A passive soil gas survey helped identify hotspots requiring remediation to meet the site-specific soil RGs. Based on the results, the Depot selected SVE as the presumptive remedy to address subsurface contamination that had caused an underlying plume of contaminated groundwater.
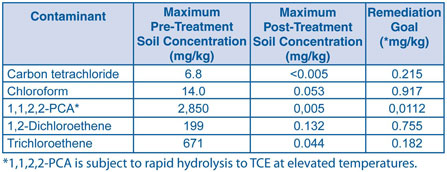
The onsite SVE pilot test indicated that full-scale SVE in the fluvial unit could be completed in four to five years, but SVE to address 1,1,2,2-tetrachloroethane (PCA) contamination in the loess would take exponentially more time. A subsequent remedial design investigation was conducted to better define the extent of contamination, particularly through use of a membrane interface probe (MIP) that could provide higher data density in the loess zone. Treatment zones were delineated according to soil cleanup levels established in the ROD.
More than 160 MIPs were pushed on 40-foot centers, and more than 80 soil samples were analyzed. MIP data revealed eight widely separated hotspots encompassing 1.25 acres shrinking the 5.5-acre hotspot identified in the remediation investigation. The total VOC mass was estimated at 12,000 pounds. The significantly reduced target area demonstrated the value of thorough site characterization and triggered selection of ISTD to replace SVE in the loess.
The ISTD system employed electrically powered heating elements suspended in 3-inch-diameter, steel-cased wells. The wells were installed 15-18 feet apart in different treatment areas depending on the contaminant concentration and properties. For example, wells were installed 15 feet apart in one area with high PCE and TCE concentrations but 18 feet apart in another area with lower concentrations and PCA as the primary COC. Prior to system startup, shotcrete was sprayed over the eight treatment areas to provide a vapor seal and insulation and to prevent water infiltration.
Active heating began in May 2008. A total of 367 heaters operating at 600-800°C were used to propagate thermal energy away from the well by way of conduction and convection. Recovered vapor was collected and transferred to an aboveground treatment unit through 68 2-inch-diameter vapor recovery wells.
ISTD performance was evaluated in terms of its operating temperature, vapor flow rate, vapor contaminant concentrations (as measured by a PID and an offsite laboratory using EPA Method TO-15), and CVOC concentrations in soil (as determined by an offsite laboratory using Method 8260). To ensure that all areas in the treatment zone reached a target operating temperature of approximately 100°C, 63 temperature monitoring strings equipped with sensors at 5-foot intervals monitored the soil temperature. The strings were generally located at the mid-point of equilateral triangles formed by selected heater wells, which provided the coldest temperatures (farthest from the heaters) within the treatment area. Twenty-six shallow wells with pressure gauges were used to verify negative pressure in the target formation during heating.
Aboveground treatment involved two granular activated carbon (GAC) systems: one comprised two 200-pound liquid-phase units to treat liquids from the condensate unit, and the other comprised two 2,700-pound vapor-phase units in line with two 3,600-pound vapor-phase units. Daily samples of vapor were collected from the wellfield influent, the treatment area headers, and three other ports in the treatment train. These samples were tested using a PID calibrated by an isobutylene standard. Once each month, vapor samples also were collected in six-liter Summa canisters at the GAC influent line and vapor discharge point and shipped to an offsite laboratory for VOC analysis. These data gauged performance progress and provided the basis for estimating the amount of contaminants recovered.
Soil confirmation sampling was conducted in a phased approach. A direct push rig with a 24-inch-long sampler containing a Teflon liner was used to collect samples. Upon retrieval, the liner was capped and placed on ice to minimize degassing. Sampling locations were chosen based on the MIP data and visual observations made during well installation.
The first soil sampling event occurred 83-85 days after heating startup, when the treatment areas reached the target temperature range. The second event occurred at completion of the planned treatment period, 106-108 days after startup. Continued high concentrations of CVOCs measured during the second event indicated several recalcitrant areas, which were subsequently re-sampled at two- to three-week intervals until RGs were met (day 174).
During later stages of heating, 10 performance sampling locations within four treatment areas continued to exhibit contaminant concentrations above the RGs, possibly due to excess soil moisture in the samples. To optimize system performance, these sampling locations were converted to SVE wells. Air was alternately injected and withdrawn from the wells to facilitate flow and vapor exchange and, within weeks, RGs were achieved throughout the remainder of the treatment area (Figure 2). RGs were considered to be achieved in a given treatment area when the arithmetic average of the verification samples (taken from the most contaminated interval) were below the RG and no single sample exceeded the RG by a factor greater than 10.
The ISTD system was dismantled in January 2009. The system had treated approximately 49,900 yd3 soil and removed an estimated 12,500 pounds of VOCs. About 10.6 million kWh of electric power had been applied over the 177 days of active source-area heating. Project costs totaled approximately $4,7489,000, or $79 per cubic yard of soil. Of this total, $1,009,736 was expended for transformer installation and power usage. SVE initiated in 2007 for the remainder of the contaminated soil at Dunn Field is anticipated to reach RG's in 2012.
Contributed by Turpin Ballard, U.S. EPA Region 4 (ballard.turpin@epa.gov or 404-562-8553)
Six-Phase Heating and SVE Used for Alameda BRAC Facility Cleanup
The U.S. Navy undertook a removal action in 2006 to address DNAPL in soil and groundwater at Installation Restoration (IR) Site 5 at the former Alameda Naval Air Station in Alameda, CA. The primary objective of the removal action was to reduce total CVOC concentrations in groundwater to below 10,000 µg/L, to the extent technically and economically practicable. Electrical heating with SVE was selected to remove VOC mass in a subsurface area affected by a plume. After 13 months of active heating, the average total dissolved CVOC concentration in targeted onsite groundwater decreased more than 99%.
Early investigations suggested the presence of DNAPL due to detection of total CVOC concentrations as high as 1,710,000 µg/L. Contaminants of concern (COCs) included PCE, TCE, DCE, dichloroethane (DCA), trichloroethane (TCA), and vinyl chloride. Subsequent investigations in 2001-2002 indicated a 33,000-ft2 plume originating in the area of a former plating shop used for aircraft maintenance until April 1997, when the base was closed as part of BRAC. Based on Hydropunch sampling at an average of 13 feet bgs, baseline concentrations of total CVOCs prior to treatment averaged 82,000 µg/L, with an estimated mass of 400 pounds. DNAPL removal was limited to a maximum depth of 13-20 feet bgs to avoid creating downward migratory pathways for DNAPL in the site’s bay sediment, which contains primarily clay, silty sand, and fine-grained sand with shell fragments overlying fractured sedimentary rock.
The target plume ("Plume 5-3") was entirely beneath Building 5, which encompassed more than 12 acres and once contained a plating shop. Some of the building walls and internal structures were removed to allow access to the entire plume area. Full-scale application of six-phase heating (SPH) of this large plume was designed for three phases to optimize use of existing equipment (Figure 3). Each phase used multiple, hexagonal heating cells wired independently and in parallel to heat areas within each cell and between cell pairs.
Five treatment cells each were installed for phases 1 and 2, and two cells were installed for phase 3. Each cell consisted of six electrodes and a neutral electrode, and each electrode consisted of four sheet-piles wired in parallel. Power for heating was provided by three tailored control units with a total output capacity of 2.5 MW, which were housed with the vapor extraction equipment inside the remaining building. Two units were instrumented with switching contactors and silicon circuit rectifiers to allow variable power to the field, as well as programmable logic controllers and personal computers. The third power supply was used to heat a single hexagonal array through manual tuning.
Vapor extraction wells were installed on a 17-foot grid across the treatment area to collect vapors. Piezometers measured the vacuum influence and ensured vapor capture inside and along the perimeter of the treatment area. Thermowells throughout the treatment zones measured temperatures achieved below ground and to gauge SPH progress.
Phase 1 of active heating began in August 2006 with a target soil and groundwater temperature of at least 90°C to ensure that the boiling temperature of all COCs was exceeded. Phases 2 and 3 began in October 2007 and November 2008, respectively, with approximately eight months needed to reposition electrodes and steel pipe between each phase. Overall plume temperatures at 12 feet bgs increased from an average of 20°C to nearly 100°C during treatment.
Monitoring during each phase of SPH operation was conducted at 17 groundwater monitoring wells once when heating began, approximately two months after start-up, and at heating shut-down. Groundwater treatment continued in each phase until asymptotic conditions were reached, as determined by specific operation and performance parameters: an average groundwater temperature of at least 90°C across the plume for a minimum of two weeks, vapor VOC mass in the vapor recovery system approaching an asymptote, and VOC concentrations below 10,000 µg/L in the monitoring wells. A final sampling event was performed on all Plume 5-3 wells three months after phase 3 to measure rebound of CVOV concentrations.
The vacuum applied to vapor extraction wells averaged 10 inches of water column but reached as much as 25 inches during treatment. The flow rate of vacuum extraction and vapor treatment systems, as measured at the exhaust stack, averaged 800 scfm and ranged from 350 to 1,100 scfm.
Final post-treatment sampling was conducted in March 2009 on all 17 monitoring wells three months after the third phase to measure rebound of CVOC concentrations. All monitoring wells showed total CVOC concentrations below 10,000 µg/L, with an average of less than 300 µg/L. Concentrations in individual wells ranged from 400 µg/L to 103,000 µg/L after the first phase of treatment and 10 µg/L to 17,000 µg/L after the second phase. After the third phase, concentrations ranged from 200 µg/L to 9,000 µg/L with an average below 300 µg/L. Based on vapor concentrations, system flow rates, and operational time, an estimated 253 pounds of VOCs were recovered in the vapor recovery system.
Plume-wide rebound sampling conducted in May 2009 to compare performance of the three treatment phases/areas showed a 78% average incremental reduction of total CVOC concentrations in groundwater: 96% reduction for the first phase (over two years of progress), 60% reduction for the second phase (over one year), and 80% reduction for the third phase (over four months).
Using multiple sheet-pile electrodes allowed for individual electrode control by increasing the surface area compared to drilled electrodes. The additional surface area also allowed energy to dissipate faster, thus increasing temperature faster across the treatment area. In addition, the stand-alone vapor extraction wells proved to be more effective than earlier applications of onsite electrical resistance heating (ERH) that were integrated with SVE due to reduced entrainment of water and silt. Use of multiple power supply units instead of a single large unit was found to enable beneficial variation in voltage and current for the electrodes.
Project costs totaled approximately $3 million (excluding equipment), which is equivalent to approximately $8,400 per pound of mass removed, or $200 per cubic yard of aquifer material. Cost comparisons against the site’s earlier projects indicate that SPH-SVE can be applied more cost effectively to smaller plumes with higher contaminant concentrations.
A total of more than 5,300,000 kWh of electricity was consumed by SPH and SVE operation, which included 2,600,000 kWh, 2,000,000 kWh, and 660,000 kWh for phase 1, 2, 3 operations, respectively. More electricity was consumed during phase 1 because SPH continued six weeks longer to achieve asymptotic conditions.
The U.S. Navy completed remedial action close-out for Plume 5-3 in January 2010. A feasibility study for remediation of Operable Unit (OU) 2C, containing IR Site 5 and two smaller IR sites, is almost complete; treatment options may include ISCO or in situ bioremediation. Remediation at OU 2C is scheduled to begin in 2013 for anticipated completion in 2018.
Contributed by James Fyfe, CA Department of Toxic Substances Control (jfyfe@dtsc.ca.gov or 510-540-3850) and Derek Robinson, U.S. Navy BRAC Program Management Office (derek.j.robinson1@navy.mil or 619-532-0951)
ISCR-Enhanced Bioremediation Accelerates Groundwater Cleanup at Active Manufacturing Facility
In the winter of 2008, full-scale in situ chemical reduction (ISCR) was implemented as a removal action at the Siltronic Corporation site in Portland, OR, to treat a source area contaminated by releases of TCE. The source area was considered to be the portion of the site with concentrations of TCE in groundwater greater than 11,000 µg/L, suggesting the presence of TCE as DNAPL. Implementation involved injecting a controlled-release, integrated carbon and micro-scale zero valent iron (ZVI) reagent (EHC™) and selected microbial agents (KB-1™) throughout approximately one-half acre of the source area accessible to drilling equipment. The approach was selected following a comparative bench testing along with other alternatives, and a successful field pilot of combined EHC+KB-1 injections. ISCR enhanced bioremediation was selected due to its: (1) lower cost when compared to alternate but resource-intensive technologies such as electrical resistance heating (ERH); (2) higher predictability than technologies such as surfactant flushing or emulsified oil sequestration; and (3) compatibility with ongoing manufacturing operations and facilities. The groundwater RAO set by the Oregon Department of Environmental Quality (ODEQ) for the source area was achieved in less than six months after completion of the injection, and TCE concentrations decreased to below the MCL in several onsite locations.
Silicon wafers have been manufactured at the 80-acre Siltronic site since 1980. Solvent releases during the early 1980s created a CVOC source area and downgradient plume approximately 1,100 feet long and greater than 500 feet wide; a portion of the plume extends under and discharges into the Willamette River. In 2006 site investigations, TCE was identified in source area groundwater at concentrations reaching 592,000 µg/L, suggesting the presence of DNAPL. Investigations also indicated a roughly half-acre TCE source area extending approximately 40-110 feet bgs and located approximately 500 feet upgradient of the riverbank. ODEQ established a groundwater RAO for the removal action of reducing dissolved-phase TCE concentrations to less than 11,000 µg/L (i.e., 1% of the TCE solubility limit) in source zone wells.
Siltronic evaluated cleanup options given the limited space to operate and proposed a controlled-release mixture of carbon and ZVI that yields redox potentials favorable for the biological reductive dechlorination of contaminants. Although the presence of 1,2-DCE, vinyl chloride (VC), ethene, and ethane in downgradient groundwater indicated natural biodegradation was occurring, Siltronic proposed augmenting the source area’s microbial populations with TCE-targeting microbes and stimulating existing populations with an additional carbon source. The combined effect of the carbon, ZVI, and augmentation was expected to increase microbial activity and reduce dissolved phase TCE concentrations through abiotic and biotic degradation. In addition, enhanced in situ bioremediation was expected to increase concentration gradients near DNAPL, thus facilitating more rapid chemical dissolution and treatment once contaminants were in the dissolved phase.
Starting in January 2009, a 30% carbon and ZVI slurry was injected to 40-112 feet bgs using a direct push (DP) drill rig. The slurry was injected on the downward push of the rig’s tailored injection head to target 4-foot vertical intervals among injection point lines at 7-foot spacing. The microbe culture was emplaced 7-14 days later in the same holes through use of a peristaltic pump and a standard DP well screen from the bottom-up. This injection process continued for six months with approximately 200 overlapping injection points advanced within accessible portions of the source area. Based on the volumes used in an earlier pilot-scale test, approximately 594,000 pounds of the carbon and ZVI fine powder and 1,831 liters of microbe culture were injected into the subsurface. Groundwater was monitored at 23 wells located within and upgradient of the treatment area, with 13 of the wells indicating TCE above 11,000 µg/L in the pre-injection sampling event. Through December 2009, TCE concentrations in all 13 of these wells had decreased to levels lower than the 11,000 µg/L goal. By April 2010, TCE concentrations had been reduced to less than 100 µg/L at 12 of the 13 wells, and by August 2010 to less than the 5 µg/L MCL in seven of the wells.
Groundwater monitoring will continue within and downgradient of the source area to demonstrate the observed TCE reductions are sustainable and to monitor potential rebound. Contaminant rebound is considered a reasonable scenario as the source area is underlain by unconsolidated fine-grained sediments, which could represent contaminant reservoirs and because DNAPL was likely present in the source area. Future monitoring will also be used to assess the effectiveness of ISCR at treating CVOCs (e.g., 1,2-DCE, and VC) produced in the source area through TCE dechlorination.
Contributed by Dana Bayuk (bayuk.dana@deq.state.or.us or 503-229-5543) and Henning Larsen (larsen.henning@deq.state.or.us or 503-229-5527), ODEQ, René Fuentes, U.S. EPA Region 10 (fuentes.rene@epa.gov or 206-553-2599), James Peale, Maul Foster & Alongi (jpeale@maulfoster.com or 503-501-5218), and Tom McCue, Sitronic Corporation (tom.mccue@sitronic.com)
