
- Featured Articles
- Site Characterization: Strategic Sampling and Adaptive Remedy Implementation for Improved Cleanup Performance at Commencement Bay-South Tacoma Channel
- Remedy Optimization: Streamlining Remedy Design through Early Optimization Evaluations
- Performance Evaluation: The Role of Monitoring During Remedy Transition Planning in a Complex Hydrogeologic Setting
- Resources
- Interagency Website: Triad Resource Center
- CLU-IN Website: High-Resolution Site Characterization
- CLU-IN Website: Optimizing Site Cleanups
- Recent EPA Guidance: Groundwater Remedy Completion Strategy; Moving Forward with the End in Mind
- Recent EPA Report: Evaluating Potential Exposures to Ecological Receptors Due to Transport of Hydrophobic Organic Contaminants in Subsurface Systems
- Recent ITRC Report: Petroleum Vapor Intrusion; Fundamentals of Screening, Investigation, and Management
 Download This Issue in Adobe PDF® Format
(1.56MB/13pp/PDF)
This issue of Technology News & Trends highlights approaches for improving and streamlining site cleanup through a broad strategy that begins with upfront planning with an eye toward project completion, as described in the U.S. Environmental Protection Agency's (EPA's) fiscal year 2014 Superfund Remedial Program Review Action Plan. EPA's plan describes short- as well as long-term measures and activities the Agency is undertaking to maintain an effective remedial cleanup program under Superfund program budget constraints. An important component of the plan is the use of an adaptive management process—an iterative approach to site investigation and remedy implementation that facilitates responding to new information and conditions throughout the lifecycle of a site. The plan also focuses on assessment, study, design and construction phases of the remedial process and outlines modified priorities for related resource management to be combined with additional increases in efficiencies.
One action underway as part of the plan is development of an Agency directive providing examples of tools and approaches that leverage the adaptive management process, such as:
- Life-cycle conceptual site models (CSMs).
- Dynamic work plan strategies.
- Groundwater remedy completion strategies.
- Early source treatment response actions followed by effectiveness monitoring.
- Phased or iterative risk assessment approaches incorporating multiple lines of evidence and ecological monitoring.
A related action involves identifying best management practices and technical resources for remedial investigation and CSM development with a focus on streamlining data collection through smart scoping, strategic sampling that uses high-resolution and real-time analytical techniques, and improved data management. Better planning and scoping of a remedial investigation/feasibility study (RI/FS) up front can help reduce RI/FS costs (including data collection costs), which have significantly increased in the Superfund remedial program over the past decade.
The projects featured in this issue illustrate ways to more effectively compile information as part of optimizing the design, implementation and monitoring of remedies and to strategically schedule key activities accordingly. Each of the featured projects involves site characterization and remediation at a National Priorities List (NPL) site.


Site Characterization: Strategic Sampling and Adaptive Remedy Implementation for Improved Cleanup Performance at Commencement Bay-South Tacoma Channel
Contributed by Kira Lynch, U.S. Environmental Protection Agency/Region 10, and Steve Dyment, U.S. Environmental Protection Agency/Office of Superfund Remediation and Technology Innovation
The U.S. EPA Region 10 office uses an adaptive site management approach that relies on high-resolution site characterization (HRSC) techniques for strategic sampling at the Well 12A project area. This approximate one-square-mile project area is one of three at the 2.5-square-mile Commencement Bay-South Tacoma Channel Superfund site in Tacoma, Washington. The vicinity of Well 12A, one of 13 wells used by the City of Tacoma to meet peak summer and emergency water demands, contains high concentrations of chlorinated volatile organic compounds (VOCs) including light and dense non-aqueous phase liquids (NAPL). Use of HRSC at Well 12A is critical to evaluating the mass discharge (flux) of contaminants associated with implementation of several treatment technologies and to determining the point at which active treatment may transition to monitored natural attenuation (MNA). The Well 12A record of decision (ROD) as amended in 2009 is the first EPA ROD specifying a mass discharge reduction as an interim goal for a remediation performance metric.
Well12A contamination is associated with past waste oil recycling operations, which resulted in release of solvent-related NAPL from drum and tank storage areas and disposal of filter cake containing NAPL. Trichloroethene (TCE) and its degradation products are the primary contaminants of concern (COCs). The well was taken out of operation when it was found to be contaminated but has operated since 1983 through use of five air-stripping systems. After the source area was identified, approximately 1,200 cubic yards of filter cake mixed with contaminated soil were excavated along a rail line and an additional 5,000 cubic yards of filter cake were removed during construction of a soil vapor extraction (SVE) system. Between 1993 and 1997, the SVE system removed an estimated 54,100 pounds of VOCs. A carbon treatment-based pump and treat (P&T) system began operating in 1988 and was expanded in 1993 with additional extraction wells. By 2011, the P&T systems had extracted and treated 860 million gallons of water and removed approximately 18,625 pounds of VOCs; however, progress towards aquifer restoration was slow, and the capture and treatment of all site-related chemicals remained a challenge.
Remedies to address this challenge recently involved excavation and offsite disposal of remaining filter cake and contaminated shallow surface soil, in situ thermal remediation (ISTR) of deeper vadose zone and saturated zone soil and groundwater, and in situ enhanced anaerobic bioremediation (EAB) of groundwater. Continued operation of the P&T system is needed to prevent migration of contaminants until their mass is significantly reduced through excavation, ISTR and EAB. The adaptive management strategy for implementing ISTR and EAB technologies involves an overlapping operating schedule to maximize use of the ISTR applied and residual heat for advancing EAB.
The highest-priority remedial action objectives (RAOs) for Well 12A are to reduce risk from contaminated surface soil and achieve at least a 90% reduction in contaminant mass discharge from the source area (below and around the former recycling building known as the Time Oil Building) to the dissolved-phase contaminant plume. Other priorities are to achieve chemical-specific applicable or relevant and appropriate requirements (ARARs) measured at alternate points of compliance and to determine if MNA can be used to achieve ARAR requirements throughout the plume.
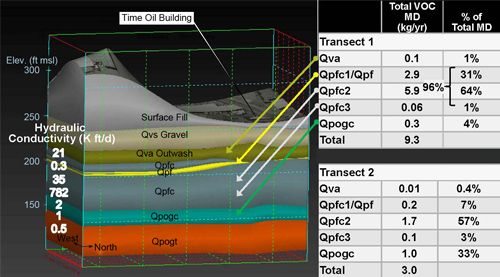
Figure 1. 3-D image of subsurface transects, and corresponding estimates of mass discharge (MD) at Well 12A
The conceptual site model (CSM) has been updated throughout the remedy design and remediation process. A major CSM refinement involved determining how to best measure and assess the mass discharge reduction goal while considering the significantly varying hydraulic conductivities, which range from 0.3 to 3,550 feet/day (ft/d) over relatively small vertical distances within the heterogeneous soil. Three-dimensional (3-D) imaging software is used to analyze the data and effectively portray the site's complex hydrogeology and the VOC spatial distribution, masses and volumes, and mass discharge transects (Figure 1).
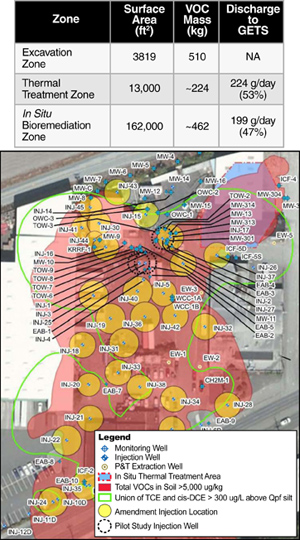
Figure 2. Analytical mapping imagery depicting contaminant mass distribution across the Well 12A site, which was used to define zones of excavation, thermal treatment, and in situ bioremediation
The refined CSM reflects two mass flux transects suggesting that most of the mass discharge occurs in three distinct hydrostatrographic units. Close to the source area in transect 1, 95% of the mass discharge occurs in two units (Figure 1) designated as Qpfc1/Qpf (accounting for 31% of the discharge) and Qpfc2 (64% of the discharge). Both units consist of primarily coarse-grained soil with a hydraulic conductivity ranging from 35 to 782 ft/d. However, the Qpf sub-unit consists of fine-grained material (conductivity below 1 ft/d) that stores contaminant mass and acts as a secondary diffusional source feeding units above and below it. Farther downgradient in transect 2, 90% of the mass discharge occurs in the Qpfc2 unit (57% of the discharge) plus a unit designated as Qpogc (33% of the discharge).This portion of the Qpfc2 unit is coarse grained (conductivity of 35-782 ft/d) while the Qpogc unit represents a mass storage area in a relatively thin finer-grained unit (hydraulic conductivity of approximately 1 ft/d) that transitions to the aquitard. The hydraulic conductivity ranges and mass discharge estimates of these hydrostratigraphic units are key elements of the lifecycle CSM as it is used throughout the adaptive remedy implementation process.
Other tools for analyzing and facilitating decision-making on the VOC mass discharge include analytical mapping software that highlights the estimated discharges to the P&T system from the thermal treatment zone and the bioremediation zone (Figure 2). Based on this information, the P&T operations were slightly modified and will be used as the method for RAO compliance. 3-D imagery and other HRSC techniques also were used to develop vertical profiles to help visualize subsurface contaminant distribution, calculate contaminant mass, and delineate treatment zones for excavation, ISTR and EAB (Figure 3). One significant benefit of using vertical profiling in this adaptive management approach is the capability to prioritize treatment based on the mass expected to be discharging to more transmissive zones. For EAB, this capability also helped reduce the target vertical interval from approximately 60 ft to 15 ft, which substantially reduced the EAB treatment volume, saved approximately $1 million in EAB amendment purchasing costs, and significantly reduced the environmental footprint of EAB implementation.
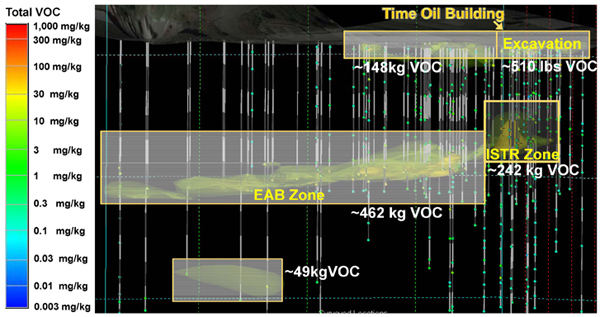
Figure 3. Vertical profile of the Well 12A VOC extent in soil of the excavation, ISTR, and EAB zones.
Excavation was completed in 2012, and a portion of the Time Oil Building was demolished in 2013. In early 2014, remediation focused on installing and operating the ISTR system and performing two rounds of EAB injections. The first round, which was conducted as a pilot test, involved injecting waste vegetable oil in two wells and a commercial, emulsified vegetable oil in one additional well. These oils were used to promote microbial activity and improve vertical distribution of other amendments to be injected a few months later.
The second injection round, completed in November 2014, entailed injecting over a million gallons of amendment including bioaugmentation culture in 47 wells at select locations to treat an area covering 3.7 acres. The injection strategy was adaptive, using different design specifications to adjust for variability in the soil permeabilities, observed contaminant mass levels, geochemical conditions, and presence of important contaminant-degrading microbes throughout the treatment zone.
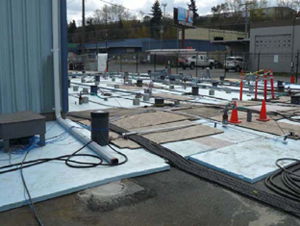
Figure 4. Well 12A ISTR electrodes at 15- to 17- foot spacing
Active ISTR heating of the subsurface began in April 2014 and continued for 117 days at an average temperature of 96.8°C, using a total of approximately 4,026,000 kWh of electricity. The operation involved use of three isolation transformers inside a power control unit to generate electrical resistance heating, 70 electrodes, 35 independent recovery wells, 299 temperature monitoring points and 23 pressure monitoring points (Figure 4).
Based on the evaluated data, it is estimated that a minimum of 22,300 pounds of contaminant mass was removed from the target treatment zone during ISTR. This total mass estimate includes approximately 9,600 pounds of VOC mass removed in the vapor phase, 7 pounds of VOC mass removed in water and 12,700 pounds of NAPL. This estimate does not include aliphatic hydrocarbons removed from the treatment volume via vapor recovery due to the difficulty in quantifying aliphatic carbons. However, based on the carbon consumption rates and other available data, it is assumed that the total mass of aliphatic hydrocarbons removed in the vapor phase is equivalent to or greater than the total mass of VOCs (9,600 pounds) removed in the vapor phase. Accounting for this additional recovery, it is estimated that a minimum of 31,900 pounds of total contaminant mass was recovered from the treatment zone.
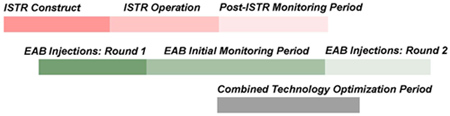
Figure 5. ISTR and EAB implementation overlap leading to availability of residual heat that can improve EAB performance at Well 12A
By implementing ISTR and EAB in parallel (Figure 5), excess or residual heat from active heating have increased temperatures in the EAB zone, fostering additional activity of anaerobic microorganisms capable of degrading the contaminants. Performance monitoring of the EAB injections indicates that high levels of carbon may persist in the target zone for at least one year, with an overall longevity of approximately two years.
EPA is currently monitoring remedial performance and progress towards reducing mass discharge. In addition, EPA is considering strategies to address previously unidentified hotspots of dense non-aqueous phase liquids that were encountered during installation of the EAB wells.
Remedy Optimization: Streamlining Remedy Design through Early Optimization Evaluations
Contributed by Vince Malott and Camille Hueni, U.S. Environmental Protection Agency/Region 6
The U.S. EPA Region 6 office recently consolidated efforts to finalize remedy designs for three Superfund sites in Texas with similar conditions: the Jones Road site, the Sandy Beach Groundwater Plume site and the East 67th Street Groundwater Plume site. Efforts focused on optimization of the preliminary designs by prioritizing each site's issues in light of budget restrictions, sequencing remediation activities in light of those priorities, and streamlining the final designs in ways expected to reduce the cleanup costs and achieve cleanup levels more efficiently. This adaptive approach to site management relied on the use of site-specific environmental data to interpret a single conceptual site model (CSM) reflecting similarities among the three sites, including the existence of chlorinated solvent plumes in relatively deep aquifers used for drinking water. Based on remedial investigations and preliminary designs, cleanup at each site also was expected to involve the same technologies: soil vapor extraction (SVE) or in situ chemical oxidation (ISCO) to address source area soil and shallow groundwater, in situ bioremediation (ISB) to address deeper groundwater, and groundwater extraction and treatment to control plume migration. Additionally, affected private groundwater wells will be abandoned at each site and the properties connected to pubic water supplies. Technical experts from EPA's Region 6 and national Superfund program and a third-party optimization review team collaborated to finalize design recommendations over a two-week period in early 2013.
The Jones Road Superfund site is located in a residential, commercial and light industrial area just outside the city limits of northwest Houston. Due to past releases from an onsite dry cleaning facility, the primary contaminants are tetrachloroethene (PCE) and its breakdown products trichloroethene (TCE), 1,2-dicloroethene (DCE) and vinyl chloride (VC). In 2008, EPA connected 144 affected properties to public water lines under a time-critical removal action. Components of the site's CSM (Figure 1) are based on information collected during development of the site's 2010 record of decision (ROD), 2011 environmental assessments and 2012 preliminary remedy designs.
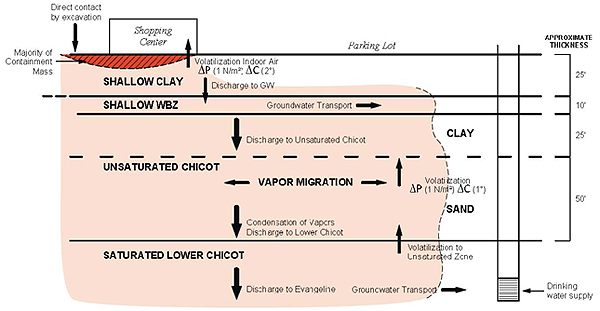
Figure 1. Contaminant migration and potential exposure pathways at the Jones Road site
The 2010 ROD selected in situ enhancements (via ISCO) and pump and treat (P&T) for the shallow water-bearing zone (WBZ) (25-35 feet below ground surface [bgs]) and the Lower Chicot WBZ (110-400 feet bgs) to contain and treat impacted ground water. Additional tests during the remedial design (RD) confirmed that natural degradation in the shallow WBZ was occurring after occasional enhancements. RD tests also confirmed high concentrations of contaminants in the vapor phase at depths of 35 to 110 feet bgs, which were likely sourcing contaminants to the underlying Lower Chicot Aquifer.
The 2014 optimization review prioritized mitigation of the two predominant vapor sources and implementation of the shallow WBZ treatment design. Although the ROD identified P&T with hydraulic containment as a remedy for the Lower Chicot WBZ, the review recommended a limited P&T system be considered only after mitigating the source and if deemed necessary based on groundwater monitoring trends. If source reduction is effective at reducing impacts to the Lower Chicot, a P&T system may not be needed or may be needed at a much smaller scale than originally anticipated. Other optimization recommendations focused on identifying data gaps for all target subsurface zones; reducing costs associated with using SVE for contaminant source reduction; further assessing possible indoor air exposure in the area of initial contaminant release; and implementing a data management system to integrate historical and future monitoring data that support this adaptive site management approach.
Based on results of the review, the ROD will be amended in 2015 to prioritize mitigation of the two vapor-phase sources. Prioritization will involve evaluating SVE and other technologies capable of more aggressively addressing volatile organic compounds in the shallow soil (0-25 feet bgs) and high PCE vapor concentrations in the upper unsaturated zone (60-110 feet bgs) of the underlying Chicot Aquifer that were previously unknown. Work to resolve existing data gaps will continue in 2015.
![Figure 2. [a] Sandy Beach site plume boundaries identified in 2010 groundwater sampling, and [b] recent aerial photo overlaid with TCE vapor boundaries identified in 2007 soil gas survey](images/201502_fig2-2.jpg)
Figure 2. [a] Sandy Beach site plume boundaries identified in 2010 groundwater sampling, and [b] recent aerial photo overlaid with TCE vapor boundaries identified in 2007 soil gas survey
At the Sandy Beach Road Groundwater Plume Superfund site, 2010 groundwater analysis showed a TCE groundwater plume approximately one-half mile wide and one mile long (Figure 2 [a]), including zones beneath some residences in the City of Pelican Bay, the adjacent City of Azle and unincorporated areas of Tarrant County in north central Texas. Many private and some public water supply wells have drawn or continue to draw water from affected depths of the two aquifers (the Paluxy and Twin Mountains Aquifers). EPA has completed residential water line connections to the City of Azle's water supply system for those residences with contaminated private water supply wells.
Early remedial investigations, including a soil gas survey, indicated the source area is located at a former dump that operated in the 1960s (Figure 2 [b]). Due to associated TCE contamination, two public water supply wells in Pelican Bay were shut down and filtration units or public water connections were installed to replace nine residential drinking water wells. The selected remedy includes a groundwater P&T system to contain the TCE plume and restore two underlying aquifers; an SVE system to remove TCE vapors in the source area above the water table; and replacement water supply wells for the residents with the remaining well filtration systems.
The optimization review identified several data gaps in the CSM. One gap concerns the materials remaining in a ravine formerly used for TCE disposal and now considered the primary source of contamination. The presence and impacts of any chemical or waste drums potentially buried in or near the ravine, however, is not fully defined. Another data gap concerns the precise distribution of TCE in shallow and saturated soils, including soils of varying porosity. Other gaps involve the magnitude and persistence of the dissolved phase plume and the potential water quality impact from proposed ISB treatments.
Through use of an adaptive site management approach that reflects the optimization review, the SVE installation activities are now prioritized in ways that simultaneously address the data gaps and enable source treatment to begin. The potential for additional sources of TCE (such as buried drums) will be evaluated during SVE system installation. Instead of the typical sequence of installing extraction wells followed by trenches and piping, the trenches and piping will be installed first in order to observe the nature of buried debris. If evidence of additional sources is encountered, field activities will shift to excavation of the additional source material. During installation of the SVE wells, saturated soil in the source area will be characterized further using sonic drilling techniques to collect soil samples from various intervals. Also, an ISB pilot test will be conducted during or following SVE operations (depending on the results of additional site characterization) to optimize treatment efficacy and identify potential impacts on water quality. Plans for the groundwater control and treatment system, now prioritized to follow source control, will include fewer extraction wells than originally anticipated but an up-scaled treatment system (up to 150 gallons per minute) in case the extraction system is expanded in the future. The plans also involve a phased approach, beginning with use of horizontal extraction/reinjection wells to contain the plume. After approximately five years of monitoring aquifer restoration, more informed decisions can be made about efficient scaling and implementation timing of the designed groundwater treatment system.
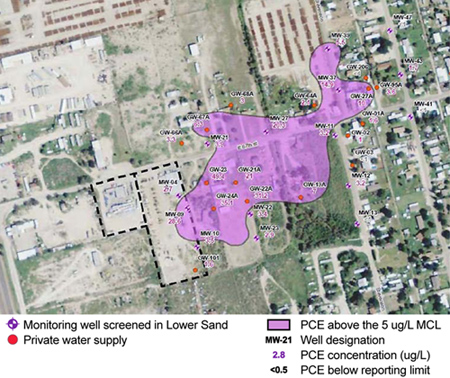
Figure 3. East 67th Street site map illustrating the PCE plume (exceeding the 5 µg/L drinking water limit) based on June 2013 sampling data
At the East 67th Street site, which is located immediately north of the City of Odessa, a groundwater contaminant plume exists due to an intentional release of over 15,000 gallons of chemicals (including 635 gallons of PCE) from a former chemical manufacturing facility (Figure 3). The underlying Trinity Aquifer is the only source of drinking water in this area. The Texas Commission on Environmental Quality installed and is maintaining filtration systems on 14 private wells within the plume. Currently, the site is being evaluated as a groundwater plume of PCE and TCE with no identified source. Although the outer boundary of the plume is not yet defined, private well samples indicate a plume size of at least 0.3 by 0.3 miles.
The selected remedy includes installation of a water supply line from the city to three new service areas within the plume boundaries. The second remedy component involves injection of nutritional amendments to enhance ISB of contaminants in the plume interior, and groundwater P&T for hydraulic containment of the plume front. The third component entails SVE to remove residual contamination beneath and surrounding the former chemical facility, ISB of contaminants in groundwater above the drinking water aquifer, and abandonment and replacement of selected private supply wells that act as a conduit for vertical migration of contaminants to the aquifer.
CSM data gaps identified through the optimization review include: the contaminant mass remaining in the vadose zone that is capable of causing long-term groundwater contamination and its response to SVE; the extent of dissolved groundwater contamination in a target layer of upper sand in the site's stratigraphy; the potential effect of ISB on secondary water quality issues such as mobilization of arsenic and metals; potential mechanisms for vertical migration of contaminants; and the extent of contaminant migration and timeframe for aquifer restoration after relevant supply wells are plugged and abandoned.
Based on optimization review recommendations that were incorporated into an adaptive site management approach, the finalized remedy design now reflects the following prioritized activities to improve project efficiencies, minimize cleanup costs and reduce the project's environmental footprint: (1) replace specific private water supply wells that may function as contaminant conduits; (2) install new groundwater monitoring wells; (3) implement ISB for the plume interior before implementing the proposed P&T system; (4) use extracted groundwater rather than fresh water for ISB substrate blending and delivery; (5) conduct a small-scale SVE pilot test near the former chemical facility to better characterize contaminant mass remaining in the vadose zone; and (6) evaluate the need for other remediation activities, such as additional ISB, after plugging supply wells that potentially act as a contaminant conduit. Work will commence accordingly in 2015.
Performance Evaluation: The Role of Monitoring During Remedy Transition Planning in a Complex Hydrogeologic Setting
Contributed by William O'Steen and Ralph Howard, U.S. Environmental Protection Agency/Region 4
Evaluation of remediation performance at the Medley Farm Drum Dump Superfund site, a former waste solvent disposal area in northern South Carolina, illustrates the need for comprehensive and structured groundwater monitoring when planning a transition to a new groundwater remedy. In this case, enhanced reductive dechlorination (ERD) will eventually transition to monitored natural attenuation (MNA) as cleanup progresses. ERD injections of lactate over the past 10 years have varied with respect to injection volumes, locations and timing. Associated groundwater monitoring and data analysis were structured to evaluate responses to each injection event rather than the injection series, which significantly limits data interpretation and predictive analysis due to its variable and complex groundwater flow patterns. As a result, evaluation of MNA as a potential final remedial action will require changing the current monitoring program and data evaluation paradigm.
Prior remediation work involved installation and startup of a groundwater pump and treat (P&T) system and a soil vapor extraction (SVE) system in 1985. Both systems were optimized from the late 1990s until 2004. The SVE system was shut down when performance objectives for soil remediation were met in 2004. Concurrently, operation of the P&T system was suspended to pilot test injections of a sodium lactate and oxygen scavenger solution to enhance conditions for reductive dechlorination of the remaining groundwater contaminants of concern (primarily chlorinated ethenes). Favorable ERD pilot results led to the amendment of the site's record of decision in 2012, specifying ERD for groundwater remediation with MNA as a contingency remedy.
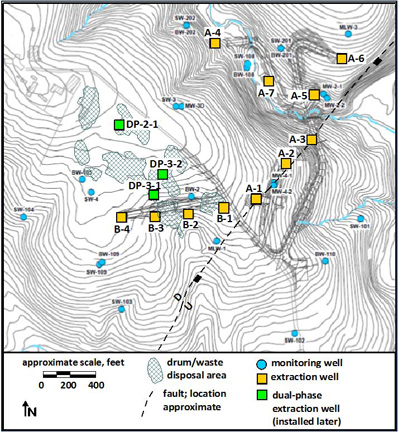
Figure 1. Location of extraction wells at the Medley Farm site in relation to onsite waste disposal areas and the reverse fault
The hydrogeologic setting of the site is complex. Exploratory trenches, geophysical investigation, and detailed geologic mapping identified two distinct near-surface lithologies separated by a northeastward-striking, reverse fault that dips steeply to the southeast (Figure 1). The former waste solvent disposal areas are upslope from the fault. The depth to the top of the schist and phyllite bedrock differs by about 20 to 70 feet across the fault. Two dominant orientations of rock fractures were identified at the site, one set striking parallel to the fault and the second set striking at near right angles. Highly weathered bedrock (the "transition zone") of varying thickness overlies the bedrock, and a 50- to 70-foot thick saprolite (primarily silt) overlies weathered bedrock in the disposal areas.
The saprolite, transition zone and bedrock are hydraulically connected. Hydraulic head measurements at most locations indicated upward hydraulic gradients from the shallow bedrock into the transition zone and saprolite across the site. The water table may be as deep as 70 feet below ground surface (bgs) in upslope areas, including the area of contaminant waste disposal, and about 10 feet bgs in downslope areas. The hydraulic conductivity (K) is estimated at 10-5 to 10-3 centimeters per second (cm/s) in the saprolite and shallow fractured bedrock and 10-4 to 10-3 cm/s in the transition zone. Limited data from deeper bedrock wells indicate a K of approximately 10-7 cm/s.
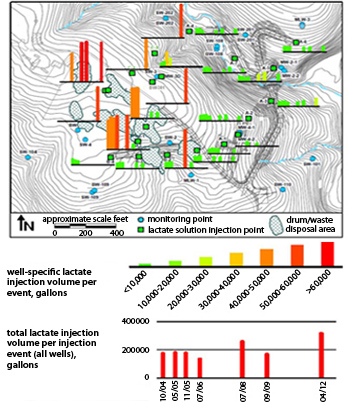
Figure 2. Lactate injection at the Medley Farm site
During remedy design, site investigation revealed that the bedrock groundwater flow is strongly controlled by geologic structures. The fault bisecting the site, for example, is a zone of preferential flow; the fault separates an upslope area of significant groundwater contamination from a downslope area of inconsequential groundwater contamination. Other fault-parallel fractures considerably upslope from the fault zone are potential conduits for northeastward groundwater flow, although some groundwater flow in this part of the site is also oriented downslope towards a southeastward trending tributary stream that appears to be aligned along a bedrock structure.
Baseline groundwater monitoring was conducted in 2004 before the first lactate injection. At that time, tetrachloroethene (PCE), trichloroethene (TCE) and their daughter products were present at a maximum summed concentration of approximately 0.4 milligrams per liter (mg/L) in the groundwater. Saprolite in the area of the most highly contaminated groundwater had been dewatered by groundwater extraction; thus, baseline data were unavailable for saprolite monitoring wells in this area. Baseline monitoring of key geochemical indicators indicated that no wells in the area of significant groundwater contamination were in an optimal environment for reductive dechlorination.
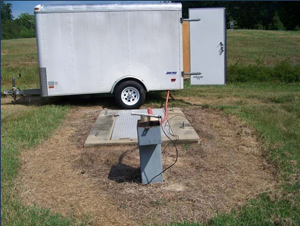
Figure 3. Lactate injection history at the Medley Farm site
Seven lactate injections were performed beginning in late 2004 and ending in spring 2012 (Figures 2 and 3). Initially, lactate was injected in 14 wells that were used previously for groundwater or dual-phase recovery. Over time, wells were added to the injection program and some of the initial injection points were omitted from some injection events. Both the lactate injection and post-injection monitoring timing and location and the magnitude of lactate injections were adjusted to fit observed groundwater quality responses to previous injections.
In September 2007, after more than a year following the fourth injection, groundwater monitoring showed that geochemical conditions were substantially improved relative to the baseline. Over half of the bedrock or saprolite/transition zone/bedrock monitoring wells and injection points in the area of significant contamination showed dissolved oxygen levels ranging from non-detect to less than 0.5 mg/L, and a groundwater pH that was much more uniform (clustered around 6 to 7) than at baseline. Monitoring showed that PCE and TCE were no longer the principal chlorinated ethenes at key monitoring and injection wells; instead, cis-1,2-dichloroethene (DCE) and vinyl chloride predominated at many monitoring points (Figure 4).
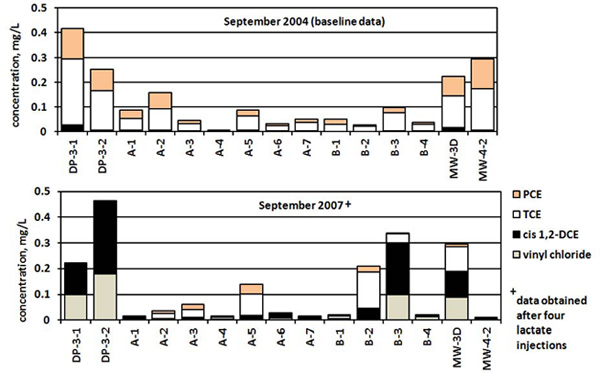
Figure 4. Chlorinated ethene concentrations in September 2004 versus September 2007, after four lactate injections at Medley Farm
Early 2008 review of the data indicated that different areas of groundwater were responding differently to the lactate injections. In particular, the re-saturated saprolite in the zone of past P&T dewatering was not favorably responding to the lactate injections. The differences suggested uncertainties regarding hydrogeologic aspects of the conceptual site model.
In 2010, priorities shifted to address concerns about the lack of groundwater monitoring points between two principal areas of residual contamination. Other uncertainties concerned the inability to discern any natural attenuation component to groundwater cleanup and the insufficient understanding of whether MNA could be an effective remedial strategy for any portion of the site. As a result, three new lactate injection wells were installed from the lower saprolite through the upper bedrock in the site's more upgradient area of groundwater contamination and upslope of the area without monitoring wells. Baseline monitoring of the new wells revealed groundwater quality similar to that observed elsewhere before the initial lactate injection, with minimal cis-1,2-DCE and vinyl chloride and substantive concentrations of PCE and TCE.
In the next (March 2012) lactate injection, a bromide tracer was added to the lactate solution injected into two of the new wells and three of the original injection wells to evaluate the injectate retention time and movement. Groundwater samples collected approximately nine months later from the three new wells indicated that the relative amounts of chlorinated ethene parents and daughters had reversed from baseline conditions. Two of these samples contained chlorinated ethenes at concentrations below groundwater performance standards. Dissolved oxygen was non-detect in all three samples.
Bromide tracer tests yielded a varied bromide retention pattern at the tracer injection wells and variable rates and directions of bromide movement. For example, although multi-level sampling in one of the new injection wells identified inconsequential flushing of bromide out of bedrock, sampling at a new well without bromide injection found that bromide injected approximately 200 feet upgradient was present three to four months after the injection. Some of the tracer remained in samples from the new injection wells almost a year after the bromide injection.
An adaptive site management approach is facilitating necessary monitoring changes and helping identify optimal timeframes for any future injections.
Monitoring results to date indicate that the current understanding of ERD progress is insufficient to enable transition to MNA as a groundwater remedy. Primary concerns are the irregular lactate injection and post-injection monitoring events, complex and incompletely understood groundwater flow paths, variable lactate migration rates, and absence of monitoring points in key locations. Conditions are either unfavorable or uncertain for continued reductive dechlorination without further lactate injection at 21 of the 24 evaluated wells completed in the transition zone and/or bedrock. Saprolite monitoring wells in the core area of residual groundwater contamination have shown limited response to the injections, and an alternate ERD treatment strategy is needed to address this contamination.
Based on these findings, EPA is using an adaptive management approach to prioritize future steps and modify the site's monitoring program. Currently, a sufficient monitoring period without further ERD injections is needed to avoid confounding interpretation of data collected for MNA assessment. Future injections and associated tracer tests are anticipated after that period to better target chlorinated ethenes in saprolite. Also, more frequent and structured groundwater monitoring is anticipated for periods following future injections, in order to more effectively assess contaminant and geochemical indicator rebound and to let any residual effects of prior lactate injections dissipate. As the new information becomes available, it will be integrated into the conceptual site model to facilitate transition from ERD to MNA.
To learn more about recent findings at this site, download the full paper, "Challenges in Planning for Groundwater Remedy Transition at a Complex Site"
RESOURCES
Interagency Website: Triad Resource Center
The Triad approach to decision-making for hazardous waste sites offers a technically defensible methodology for managing decision uncertainty that leverages innovative characterization tools and strategies. "Triad" refers to three primary components: systematic planning, dynamic work strategies and real-time measurement systems. The Triad Resource Center provides an overview of key concepts, guiding principles and benefits of the approach; information for site managers considering the use of Triad; descriptions of regulatory functions that are required when using Triad; and profiles of projects where Triad has been implemented as part of site characterization and remediation activities at federal and private sites.
CLU-IN Website: High-Resolution Site Characterization
HRSC is a new focus area on EPA's CLU-IN website that reflects the state-of-the-science for environmental site characterization. HRSC strategies and techniques use scale-appropriate measurement and sample density to define contaminant distributions as well as the physical context in which they reside with greater certainty, supporting faster and more effective site cleanup. The HRSC focus area offers details about what constitutes HRSC, explains approaches for conducting HRSC, and provides case studies involving technologies or strategies, such as direct sensing or discrete multi-level sampling.
CLU-IN Website: Optimizing Site Cleanups
This CLU-IN focus is a comprehensive resource for EPA's National Strategy to Expand Superfund Optimization Practices from Site Assessment to Site Completion, which aims to expand and formalize optimization practices as an operating business model for the Superfund remedial program. This online resource provides an overview of the stages and key components of optimization, site-specific reports on independent optimization reviews conducted at Superfund sites, a searchable set of key guidance documents and tools, links to relevant federal and state resources, and contact information for EPA technical experts.
Recent EPA Guidance: Groundwater Remedy Completion Strategy; Moving Forward with the End in Mind
EPA's Office of Superfund Remediation and Technology Innovation partnered with the Agency's Federal Facility Restoration and Reuse Office in developing Groundwater Remedy Completion Strategy: Moving Forward with the End in Mind. This May 2014 guidance document is intended to help focus resources on the information and decisions needed to effectively complete groundwater cleanups involving active and/or passive groundwater restoration remedies under CERCLA. Topics addressed in the guidance include design of site-specific remedy evaluations, development of performance metrics and collection of associated monitoring data, and a process for conducting remedy evaluations.
Recent EPA Report: Evaluating Potential Exposures to Ecological Receptors Due to Transport of Hydrophobic Organic Contaminants in Subsurface Systems
The occurrence of substantial concentrations of hydrophobic organic contaminants (HOCs) such as polychlorinated biphenyls or dioxin in groundwater presents a conundrum in that HOCs are generally immobile in subsurface systems. For systems in which there is hydraulic connection between the contaminated aquifer and downgradient surface water bodies, assessment of ecological exposure to HOCs may be required. This technical paper (EPA/600/R-10/015), which was compiled by the Ecological Risk Assessment Support Center of EPA's Office of Research and Development, recommends several types of screening assessments to evaluate site conditions for the potential to enhance transport of HOCs. The paper also addresses related site artifacts that result from inadequate well installation and sampling procedures within a groundwater monitoring network.
Recent ITRC Report: Petroleum Vapor Intrusion; Fundamentals of Screening, Investigation, and Management
State agencies across the country have consistently listed vapor intrusion as a high-priority topic for sites contaminated with volatile organic compounds. The Interstate Technology & Regulatory Council (ITRC) developed this guidance document to specifically address petroleum hydrocarbons and vapors, which behave differently in the subsurface when compared to chlorinated organic compounds. The document describes an eight-step process for screening, investigating and managing sites to address the petroleum vapor intrusion pathway. The document also provides a screening approach based on a peer-reviewed empirical data set, discusses the role of conceptual site models and multiple lines of evidence to support site decision-making, and offers a toolbox for investigation methods and analysis.
Contact Us:
Suggestions for articles in upcoming issues of Technology News and Trends may be submitted to
Linda Fiedler via email at fiedler.linda@epa.gov.
Past Issues:
Past issues of the newsletter are available at http://www.clu-in.org/products/newsltrs/tnandt/.
Archives | Subscribe | Change Your Address | Unsubscribe
