
- Featured Articles
- Performance Monitoring: Evaluating a Wheat Straw PRB for Nitrate Removal at an Agricultural Operation
- Performance Monitoring: Evaluating an Organic Carbon-Limestone PRB for Treatment of Heavy Metals and Acidity
- Performance Monitoring: Bromide Tracer Test and CSIA Characterize Treatment of TCE in Mulch Biowall
- Project Update: ZVI Used for Arsenic from Lead Smelting Facility
- Resources
- CLU-IN Website
- Federal Remediation Technologies Roundtable (FRTR)
- Interstate Technology & Regulatory Council (ITRC)
- Upcoming Training
 Download This Issue in Adobe PDF® Format
(1.62MB/13pp/PDF)
This issue of Technology News & Trends highlights the use of permeable reactive barriers (PRBs) to treat groundwater plumes containing organic or inorganic contaminants. Each featured article describes work by the U.S. Environmental Protection Agency (EPA) National Risk Management Research Laboratory to evaluate long-term performance of PRBs constructed of carbon-rich organic materials, zero-valent iron, or other substrates. Monitoring results indicate that PRB performance can change significantly over time due to factors such as reactive media depletion, fluctuations in rainfall, or a site's hydrologic conditions.
FEATURED ARTICLES


Performance Monitoring: Evaluating a Wheat Straw PRB for Nitrate Removal at an Agricultural Operation
Contributed by Stephen R. Hutchins, Ph.D., and Richard T. Wilkin, Ph.D., U.S. EPA National Risk Management Laboratory
The U.S. EPA Office of Research and Development's National Risk Management Research Laboratory (NRMRL) is conducting long-term monitoring of a permeable reactive barrier (PRB) for remediation of groundwater contaminated with nitrate from a now-closed swine concentrated animal feeding operation (CAFO) in Oklahoma. Extensive groundwater contamination by both nitrate and ammonium arose from a leaking waste lagoon during seven years of operation. The selected remediation strategy involved installing an interception trench barrier for recovery and subsequent above-ground treatment of ammonium through use of an evaporation basin. A PRB containing commercial wheat straw as the reactive matrix was installed for in situ treatment of nitrate resulting from nitrification of the lagoon's ammonium plume and also from excessive land application of lagoon effluent.
The PRB was constructed in 2003 in a shallow aquifer consisting of fractured sandstone with interspersed clay and sand lenses that are underlain by a thick layer of shale at approximately 25 to 50 feet below ground surface (bgs). A trench approximately 840 feet long and 4 feet wide was excavated to intercept the contaminant plume at 8 to 18 feet bgs. Approximately 4,500 square and 300 round bales of wheat straw were emplaced in the trench. The rate of groundwater flow through the PRB is estimated at 500 feet/day.
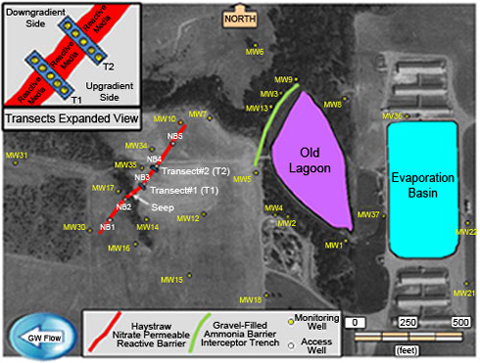
Figure 1. Aerial view of PRB, wells, and surface features at the Oklahoma CAFO site.
The PRB was not constructed on level terrain. As a result, much of it slopes sharply toward a center drainage area between access wells NB1 and NB3 (Figure 1). A seep in this drainage area emanates from the top surface of the PRB and consequently acts as a seasonal discharge point. Because the PRB matrix is 500 to 4,000 times more permeable than the aquifer matrix, there is a significant potential for longitudinal flow within the PRB toward this seep.
In 2004, NRMRL researchers established transects across the PRB at two locations, each with fully screened 2-inch PVC wells upgradient, within, and downgradient of the PRB (Figure 2). Although the goal was to place three wells inside the PRB at each transect, uncertainties regarding the location of the PRB boundary led to the final position of well T2B being slightly upgradient of the PRB at transect #2.
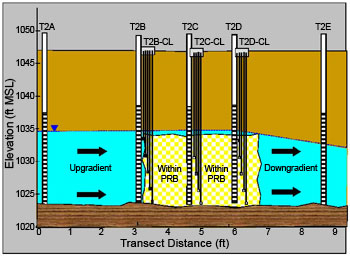
Figure 2. Groundwater quality monitoring wells within the PRB at transect #2.
To provide vertical resolution of water quality within the PRB, cluster wells were also installed at transect #2 using 0.25-inch polyethylene tubing with 6-inch-long stainless steel well screens to a depth of 14 to 23 feet bgs (Figure 2). Quarterly monitoring of the transect wells for multiple parameters began in 2004; this schedule was scaled back to annual sampling in 2008 and continues to the present. During the nine-year study period, groundwater elevations fluctuated by as much as 4-6 feet due to weather extremes, which included droughts in 2004 and 2011 and excessive rainfall in 2007. These conditions also affected PRB performance.
Denitrification occurred rapidly within the PRB soon after construction. Although monitoring of the transect wells did not begin until 2004, analysis of samples from the five PRB access wells taken four months after start-up revealed an actively reducing environment. Reducing conditions included an oxidation-reduction potential of -63 to -98 millivolts and pH of 3.7 to 4.5, with high organic carbon (total organic carbon (TOC) of 1,030 to 3,920 milligrams per liter [mg/L]) and no detectable nitrate (< 0.004 mg/L nitrate-nitrogen). Ammonium production, however, was substantial (36 to 250 mg/L ammonium ion-nitrogen). One source of ammonium could be the decomposition of organic nitrogen in the straw. Another potential source is the dissimilatory nitrate reduction to ammonium (DNRA), which is common among fermentative bacteria and would be expected under conditions of low oxygen, low nitrate, and high TOC.
Over time, the high ammonium concentrations dissipated. Based on transect well data, monitoring results showed that denitrification was occurring at both transect locations and the PRB chemistry generally began working as expected. After two years of PRB operation, subsidence was observed along the barrier length. Subsidence worsened with time to the point that ground surface elevations dropped as much as 5 feet at the centerline along much of the PRB, especially in sections northeast of the seep. The subsidence was attributed primarily to extensive decomposition of the straw matrix, and the decision was made to not replenish this material. Excessive rainfall likely exacerbated this condition in 2007, when the PRB began collecting runoff and creating a temporary infiltration gallery along much of its length.
These events are evident in the water chemistry at transect #1 (Figure 3). For the first four months, nitrate was generally absent within the PRB and excess TOC existed for denitrification. The nitrate concentrations dropped slowly in the downgradient well T1E and then unexpectedly rose. This trend may be due to a greater component of longitudinal flow within the PRB at this location toward the seep, thereby providing partial isolation of this well location. It is also possible that ammonium initially produced by DNRA migrates downgradient of the PRB and, as the groundwater slowly aerates, is converted to nitrate through nitrification.
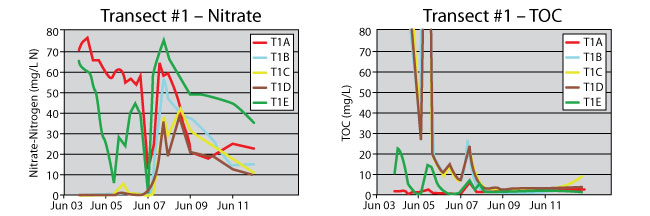
Figure 3. Transect #1 groundwater nitrate and TOC profiles in upgradient (T1A), within-PRB (T1B, T1C, T1D) and downgradient (T1E) wells.
The effect of excessive rainfall in 2007 can be seen in the water chemistry data; infiltrating runoff caused substantial outflow from the PRB in both directions, drastically lowering nitrate levels in both upgradient well T1A and downgradient well T1E (Figure 3). The event also appears to have brought TOC into the PRB at this location, although TOC levels subsequently dropped rapidly and continued to decline. The decrease in TOC corresponds with an increase of nitrate within the PRB, which has led to substantial failure of the PRB at this location.
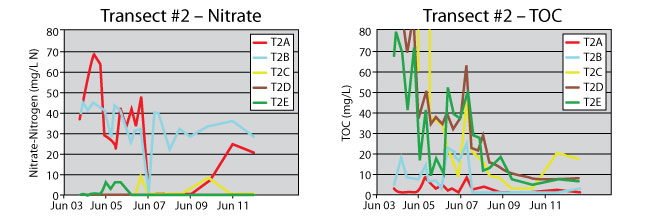
Figure 4. Transect #2 groundwater nitrate and TOC profiles in upgradient (T2A, T2B), within-PRB (T2C, T2D), and downgradient (T2E) wells.
In contrast, the PRB continues to perform effectively at transect #2. Denitrification is quite active, and nitrate concentrations have remained below 0.2 mg/L nitrate-nitrogen in the downgradient well T2E since 2007 (Figure 4). Unlike transect #1, TOC persisted for a longer time within the PRB at this location. This persistence may be attributed to the downward slope of the PRB in both directions at this point, which reduces longitudinal flow along the PRB length and lowers the infiltration components, consequently preserving more of the straw matrix. The high rainfall event in 2007 also caused outflow from the PRB in both directions at this transect; however, recovery time for well T2A was much longer than for well T2B.
Overall results of monitoring since 2004 indicate that the PRB is beginning to fail, especially in areas where longitudinal flow and infiltration of rainfall runoff may have rapidly depleted TOC. Because replenishment of the straw matrix or backfill of the subsided areas is not expected, it is unclear whether the PRB performance will outlast the anticipated reduction in nitrate mass influx. The high levels of ammonium initially produced within the PRB are an additional concern, since the amount of ammonium transported to areas beyond the PRB is unknown. For the past seven years, ammonium plumes have been observed at two downgradient wells (MW34 and MW35) with levels of ammonium ion-nitrogen peaking at 10 to 13 mg/L and slowly dropping to current levels of 2 to 4 mg/L.
NRMRL plans to continue monitoring performance of the PRB as long as possible. Discussions are pending between responsible parties and regulatory personnel on what additional steps, if any, need to be undertaken to bring this site to appropriate closure status.
Performance Monitoring: Evaluating an Organic Carbon-Limestone PRB for Treatment of Heavy Metals and Acidity
Contributed by Ralph Ludwig, Ph.D., Richard T. Wilkin, Ph.D., Steve Acree, and Randall Ross, Ph.D., U.S. EPA National Risk Management Research Laboratory; Katrina Higgins-Coltrain, U.S. EPA Region 6
Since 2004, researchers from the U.S. EPA National Risk Management Research Laboratory (NRMRL) have annually evaluated performance of an organic carbon-limestone permeable reactive barrier (PRB) system installed in 2003 by EPA Region 6 at the Delatte Metals Superfund site in Ponchatoula, Louisiana. Based on early results from testing of two pilot-scale PRBs, a full-scale PRB was installed adjacent to the pilot PRBs to fully intercept and treat a low-pH, heavy metal groundwater plume prior to entry into nearby surface water. As constructed, the full-scale PRB contained approximately 67% composted cow manure and 33% limestone and measured 1.8 meters wide, 4-5 meters deep, and over 300 meters long. The most recent (2011) round of hydrologic and chemical data shows sustained effective treatment of the target contaminant plume by the collective PRB system (two pilot-scale PRBs plus one full-scale PRB), but also shows signs of possible depletion of the reactive media in one of the former pilot-scale PRBs.
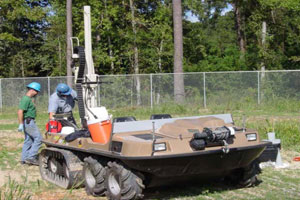
Figure 1. GeoProbe® deployment on a swamp buggy to install monitoring wells.
The site was used previously for battery recycling. Onsite activities included spent lead-acid battery demolition and lead smelting of battery lead plates to produce lead ingots. Initial remedial actions involved excavation, treatment, and offsite disposal of approximately 32,400 cubic meters of impacted soil. A large, low pH (<3.2), high acid-generating (high acidity) groundwater plume containing significant concentrations of heavy metals remained and continued to discharge to a creek. Cumulative yearly average lead (Pb), cadmium (Cd), and nickel (Ni) concentrations as high as 80.9 micrograms per liter (µg/L), 451 µg/L, and 408 µg/L, respectively, have been measured in wells immediately upgradient of the PRB.
The primary objective of installing the PRB system was to raise the pH and remove heavy metals, such as lead and cadmium, from impacted groundwater to the extent possible by promoting microbially mediated sulfate reduction and limestone dissolution. Operation of the two pilot-scale PRBs for approximately one year helped evaluate candidate organic carbon-limestone matrices. One consisted of the 2:1 cow manure and limestone gravel mixture while the other contained a reported 1:1:1 mixture of cow manure, wood chips, and limestone gravel. Each pilot-scale PRB measured 1.8 meters wide, 4.3 meters deep, and 30 meters long. The mixture of 2:1 manure and limestone was ultimately selected for full-scale application due to its better removal of heavy metals during the brief pilot study. After construction of the full-scale PRB was complete, monitoring wells were installed in multiple transects across the collective PRB system (Figure 1).
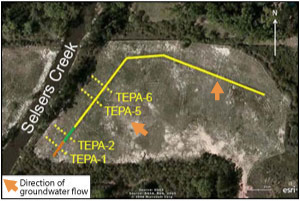
Figure 2. Configuration of PRB system at the Delatte Metals site showing locations of transects sampled; orange segment represents former pilot-scale PRB containing 1:1:1 cow manure, wood chips, and limestone gravel, and green segment represents former pilot-scale PRB containing 2:1 cow manure and limestone (as used in full-scale PRB depicted in yellow).
One transect through each of the two pilot PRBs and two transects through the full-scale PRB are monitored annually. Transect TEPA-1 traverses the former pilot PRB consisting of the 1:1:1 mixture of manure, wood chips, and limestone that now comprises the southern end of the PRB system (Figure 2). Transect TEPA-2 traverses the former pilot-scale PRB consisting of the 2:1 manure/limestone mixture also used in the full-scale PRB. The remaining two transects (TEPA-5 and TEPA-6) traverse the full-scale PRB at locations where target contaminant concentrations entering the PRB were initially observed to be highest.
The annual monitoring program involves hydrologic measurements and groundwater sampling. The hydrologic measurements include collection of groundwater elevation data at wells within and surrounding the PRB system. Hydraulic conductivity within and adjacent to the PRB is estimated using slug testing in approximately 70 wells. Resulting data indicate that both the PRB and native materials upgradient of the PRB are highly heterogeneous.
The hydraulic heads along the PRB suggest the majority of the groundwater plume is flowing through the PRB system. The average seepage velocity of water moving through the PRB has been calculated to be between 3 centimeters per day (cm/d) and 6 cm/d. Due to the significant heterogeneity of native materials, however, significant uncertainty about this range exists. Some groundwater mounding has been observed upgradient of the PRB, indicating the average hydraulic conductivity within the PRB at some locations may be lower than that of the surrounding aquifer. Slug testing within the PRB at various locations has indicated hydraulic conductivity values spanning at least an order of magnitude.
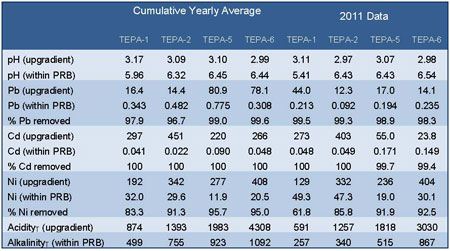
Table 1. Cumulative average yearly concentrations (pH, akalinity, acidity since 2004; Cd and Pb since 2006, Ni since 2008) and 2011 average concentrations upgradient and within PRB system; Pb, Cd, and Ni measured in µg/L, acidity measured in mg/L CaCO3. equivalents; and alkalinity measured in mg/L CaCO3.
Groundwater sampling data have shown effective treatment of targeted contaminants along all four transects. Flow through the PRB system is confirmed by significant PRB-induced geochemical changes on the downgradient side of the PRB. For example, data collected in 2011 from wells approximately 15 meters downgradient (near the creek's edge) show pH values exceeding 6.1 and alkalinity values exceeding 400 milligrams per liter (mg/L) as calcium carbonate (CaCO3) along all four transects. This contrasts with significantly lower pH values (as low as 2.97) and acidity values as high as 3,030 mg/L (as CaCO3 equivalents) in groundwater entering the PRB during 2011.
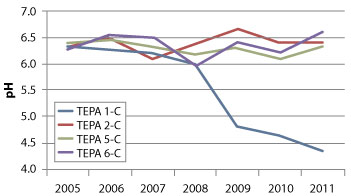
Figure 3. Seven-year trends in groundwater pH at monitoring transects in the PRB's upgradient half.
More recent pH measurements along TEPA-1 may indicate the first signs of reactive media depletion in the former pilot-scale PRB consisting of the 1:1:1 mixture of cow manure, wood chips, and limestone gravel. Specifically, pH within its upgradient half along TEPA-1 (Figure 3) has gradually decreased over the past few years, suggesting the treatment media at this location is no longer adequately neutralizing the low pH groundwater entering the PRB. Treatment in the downgradient half along this transect, however, remains effective. A possible cause of the reduced treatment performance in the upgradient half may be depletion of the manure and inability of the wood chips to adequately compensate for the depletion.
Monitoring of PRB performance by NRMRL at this site will continue annually, pending availability of funding. Future activities will focus on evaluating whether or not the PRB system will outlast the groundwater plume.
Performance Monitoring: Bromide Tracer Test and CSIA Characterize Treatment of TCE in Mulch Biowall
Contributed by John Wilson, Ph.D., U.S. EPA, Hai Shen, U.S. DOE
The Air Force Center for Engineering and the Environment, in collaboration with the National Nuclear Security Administration, conducted a bromide tracer test and a compound-specific isotope analysis (CSIA) investigation at the Altus Air Force Base (AFB) Landfill 3 (a RCRA Corrective Action Site) in Oklahoma to characterize the remedial performance of a mulch biowall. The bromide tracer helped delineate the groundwater flow pattern and established a field-scale rate constant for removal of trichloroethene (TCE) in the biowall to better understand the residence time of TCE. CSIA subsequently was used to identify the carbon isotope ratio (13C/12C or δ13C) of TCE to determine the role degradation plays in reducing TCE concentrations.
Landfill 3 was used for disposal of hazardous materials, including TCE, from aircraft maintenance activities and industrial operations from 1956 to 1965. The gypsum-rich soil at the site consists of approximately 5 feet of clayey silt underlain by weathered, silty clay extending to the top of dense shale approximately 23 to 35 feet below ground surface (bgs). Depth to groundwater within the unconfined shallow aquifer varies seasonally from 6 to 12 feet bgs, with groundwater flowing to the southeast. TCE and its daughter product, cis-1,2-dichloroethene (cis-1,2-DCE), were the most prevalent chlorinated volatile organic compounds (VOCs) detected in the groundwater. Prior to biowall installation, TCE and cis-1,2-DCE concentrations as high as 8,000 micrograms per liter (µg/L) and 1,800 µg/L, respectively, were measured.
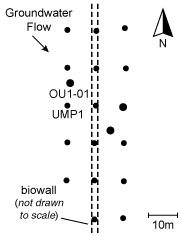
Figure 1. Plan view showing the biowall (dashed lines) and the monitoring network.
A mulch biowall composed of shredded tree mulch (48%), cotton gin compost (10%), and river sand (42%) was installed in June 2002 to demonstrate enhanced in situ bioremediation of VOCs and to address dissolved TCE discharges to an adjacent creek. The 455-foot-long, 1.5-foot-wide, and 24-foot-deep biowall was constructed to intercept the groundwater profile. The biowall does not extend to the top of the shale because the maximum depth entrenching tools could reach at the time of installation was 25 ft bgs. In addition, because the biowall was designed as a pilot, it does not intercept the entire width of the TCE plume. As a result, migration of groundwater underneath the biowall trench or around the edges of the biowall is possible. Figure 1 provides a layout of the biowall relative to groundwater flow and the location of monitoring wells.
The geochemistry of groundwater within the biowall significantly changed within one month of biowall installation. Changes providing conditions favorable for the reductive dechlorination of TCE and DCE included a reduction of sulfate and production of ferrous iron, hydrogen sulfide, and methane. The oxidation-reduction potential (ORP) decreased from about 100 millivolts (mV) in upgradient wells to about -300 mV in wells within the biowall, indicating highly reducing conditions. Over time, the ORP downgradient of the biowall also decreased to about -100mV. The 2,800 mg/L total organic carbon (TOC) concentration within the biowall was very high compared to 5 mg/L upgradient; TOC within the biowall decreased over time due to consumption of the plant-released organic compounds by various microorganisms. Sampling confirmed presence of Dehalococcoides, organisms important for reductive dechlorination, within and 29.5 feet downgradient of the biowall.
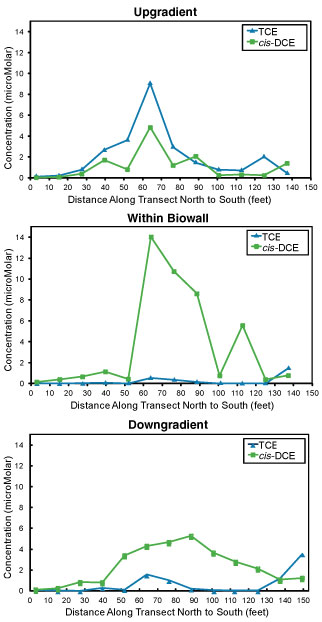
Figure 2. Contaminant concentrations in August 2006 showed increased cis-1,2-DCE and VC concentrations within the biowall and downgradient as TCE concentrations decreased, suggesting occurrence of reductive dechlorination.
Local concentrations of TCE significantly decreased within one month of biowall installation, from approximately 6,044 µg/L (46 micromoles per liter [µM]) upgradient of the biowall to an average of 1,313 Îg/L (10 µM) within the biowall. By 2006, upgradient TCE concentrations decreased to a maximum of 1,182 µg/L (9 µM) likely due to attenuation. Upgradient cis-1,2-DCE and vinyl chloride (VC) concentrations fluctuated from near zero to just above 1200 µg/L both before and after biowall installation.
Within the biowall and at downgradient wells, TCE concentrations declined to an average of 53 µg/L (0.4 �M), though downgradient TCE levels were slightly higher than within the biowall. Concentrations of both cis-1,2-DCE and VC increased within the biowall from a maximum of 850 µg/L (8.7 µM) cis-1,2-DCE and 7.3 µg/L (0.12 µM) VC in 2002, to a maximum of 1,357 µg/L (14 µM) cis-1,2-DCE and 177 µg/L (2.8 µM) VC in 2006. The decline in TCE concentrations between 2002 and 2006 as cis-1,2-DCE to VC concentrations increased, suggested that reductive dechlorination of TCE to cis-1,2-DCE to VC was occurring (Figure 2).
The overall attenuation of TCE in the biowall was found to sufficiently address discharge of high levels of TCE to the adjacent freshwater creek. However, to delineate the groundwater flow pathway and help determine the cause of rebound in TCE concentrations downgradient of the biowall, a bromide tracer test was conducted in April 2005. A solution containing 15.5 grams per liter (g/L) bromide was injected into monitoring well OU1-01 (Figure 3) located 26 feet upgradient of the biowall. The bromide solution was injected as a slug in the middle of the injection well screen (about 13 feet bgs) at a pumping rate of 0.01 liter per minute (L/min) over 26 days. During the injection period, groundwater was continuously circulated within the injection well to distribute the bromide across the length of the well screen At the same time, groundwater was continuously circulated between the injection well OU1-01 and an adjacent well (UMP1) less than 32 feet to the south and cross-gradient to groundwater flow, by pumping groundwater from UMP1 to OU1-01 at a rate of around 0.8 L/min.
The Geoprobe Macrocore® system was used to collect soil cores from the area between wells OU1-01 and UMP1, which were then analyzed for bromide to determine pathways of groundwater flow. Concentrations of bromide measured in pore water were higher at depths of 5.9 to 12.8 feet bgs, suggesting a preferential flow path at this interval. Groundwater samples from nested wells showed that concentrations of TCE, cis-1,2-DCE, and VC in the preferential flow path were 22 to 556 times higher than the concentrations in the deeper zone of the well interval (12.8 to 23.9 feet bgs).
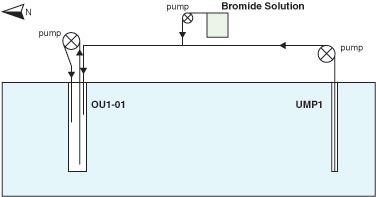
Figure 3. Process schematic illustrating bromide solution injection into well OU1-01 and pumped recirculation of the solution between the injection well and EPA's monitoring well.
Pore water concentrations of bromide in the biowall also were used to determine a seepage velocity of 0.06 meters/day. The seepage velocity and the estimated effective porosity of the biowall were used to calculate the Darcy velocity of groundwater entering the biowall. Based on the Darcy velocity, width of the biowall in the direction of groundwater flow, and the water-filled porosity of the biowall (29%), the average residence time of groundwater in the biowall was estimated to be 10 days. The 10-day groundwater residence time and TCE concentration reduction between wells upgradient and downgradient of the biowall were used to estimate a first-order rate constant for TCE removal in the biowall, ranging from 0.38 to 0.15 per day. Using STANMOD software to fit breakthrough curves for bromide, the rate constant was independently found to range from 0.13 to 0.17 per day with an average value of 0.14 per day.
The presence of a preferential flow pathway causes differences in residence time of groundwater in the biowall, which result in vertical variations in contaminant degradation within the biowall matrix. When water enters the biowall from the transmissive zone, its flow path diverges. Water moving directly across the biowall has the shortest residence time. Water moving along less direct paths has a longer residence time within the biowall (between 10 and 26 days) and therefore has more time in contact with biowall matrix materials.
CSIA was performed in September 2007 to help determine whether the reduction of TCE was the result of biological transformation rather than dilution or sorption. In cases where biotic or abiotic degradation is occurring, the parent compound TCE becomes enriched in 13C (less negative δ13C value) in downgradient groundwater when compared to source area groundwater. Since bonds between lighter isotopes are easier to break, degradation reactions occur faster for compounds containing lighter 12C isotope than those containing heavier 13C. The degree of enrichment or fractionation depends on the specific reaction mechanisms taking place during degradation.
During the CSIA, groundwater samples from wells within the biowall as well as 30 feet upgradient, and 30 feet downgradient were analyzed for the presence of chlorinated volatile organic compounds, and gas chromatography and isotope ratio mass spectrometry were used to determine the δ13C for TCE.
TCE in groundwater samples was measured at 550 µg/L upgradient of the biowall and 58.4 µg/L downgradient of the biowall but was not detected within the biowall. The TCE δ13C value upgradient of the biowall was -26.0� (parts per thousands or "per mil"), just beyond the high end of the range of d13C value of commercial TCE, and assumed to be close to source area TCE δ13C values. Downgradient of the biowall, δ13C values averaged -23.6�. Carbon isotope values were not calculated for TCE within the biowall due to the insufficient concentrations. The absence of TCE detection within the biowall indicated substantial degradation.
The similar δ13C values of TCE upgradient and downgradient of the biowall indicated that most of the TCE found downgradient had not degraded. The pattern of stable isotope values for carbon in TCE along the flow path of groundwater suggests that much of the reduction in TCE concentrations in the downgradient well was not due to destructive attenuation processes. Possible explanations for the observed pattern of TCE concentrations and δ13C values of TCE along the flow path of groundwater are (1) enhanced contaminant retardation within the biowall; (2) hydrodynamic mixing of residual TCE not degraded while passing through the biowall with dissolved TCE already present in the aquifer when the biowall was installed; and/or (3) TCE-contaminated groundwater that had not passed through the biowall as it moved downgradient.
The bromide tracer test and subsequent CSIA indicated that TCE is passing through and being substantially degraded within the biowall. However, by clarifying variations in hydraulic conductivity in the aquifer, the bromide tracer test showed that local variations in hydraulic conductivity produce variations in the residence time of groundwater in the biowall matrix and subsequent variations in the extent of treatment as groundwater passes through it. These results have implications for biowall design, which is typically based on a site-specific first-order degradation rate that does not account for variations in hydraulic conductivity. By more fully integrating CSIA data with groundwater velocity data obtained from the bromide tracer test, CSIA can be used to provide an additional line of evidence for quantifying the rate of TCE degradation and identifying the role it plays in overall TCE attenuation as TCE-contaminated groundwater transits a mulch biowall.
Project Update: ZVI Used for Arsenic from Lead Smelting Facility
Contributed by Contributed by Richard T. Wilkin, Ph.D., Steven D. Acree, Randall R. Ross, Ph.D., Douglas G. Beak, Ph.D., and Tony R. Lee, EPA National Risk Management Research Laboratory
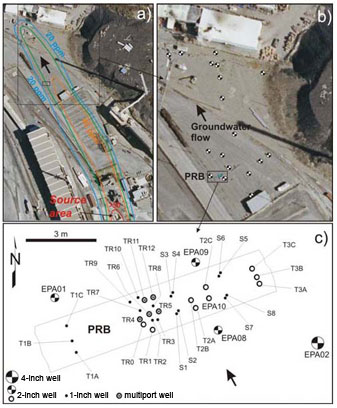
Figure 1. Maps showing arsenic plume extent, location of PRB, and monitoring well locations around and in the PRB.
Ongoing studies at the East Helena Superfund site near Helena, Montana, show that a permeable reactive barrier (PRB) containing zero-valent iron (ZVI) can be used effectively to treat arsenic-contaminated groundwater in a complex hydrogeologic environment. The PRB was installed at this former lead smelting facility in June 2005 on a pilot-scale basis. At the time of construction completion, the PRB contained approximately 175 tons of ZVI filings in a trench approximately 6 feet wide, 46 feet deep, and 30 feet long. [See the November 2005 issue of Technology News and Trends for more information about the installation.] Studies demonstrate that detailed geochemical and hydrogeologic data, including flux-based analysis, are critical to evaluating the PRB's efficacy for both trivalent and pentavalent arsenic. Six years of monitoring also have revealed shortcomings of the hanging-wall design used for PRB construction.
The monitoring network encompasses approximately 40 groundwater sampling points at 17 1-inch-diameter wells, nine 2-inch wells, four 4-inch wells, and five multiport wells (Figure 1). Groundwater samples have been collected and analyzed after 1 month, 4 months, 12 months, 15 months, 25 months, 39 months, 51 months, and 63 months of PRB installation. Concurrent to each sampling event since 2006, hydraulic gradients were estimated from water table elevation measurements. Field measurements of hydraulic conductivity were made using single-well pumping tests and pneumatic slug testing.
The concentration of arsenic in groundwater entering the PRB averages about 25 milligrams per liter (mg/L). Arsenic concentrations within the PRB have generally been below 0.05 mg/L. Of 120 groundwater samples collected from within the PRB, arsenic concentrations in 26 samples exceeded 0.050 mg/L, 94 were at or below 0.050 mg/L, and 43 were at or below the 0.010 mg/L maximum contaminant level for arsenic (Figure 2). The highest arsenic concentrations appear to be restricted to deeper wells within the PRB, which likely reflects areas with fast groundwater seepage velocities and/or where a lower volume of ZVI was emplaced due to partial collapse of the trench. Arsenic within the PRB is present in both the pentavalent and trivalent states.
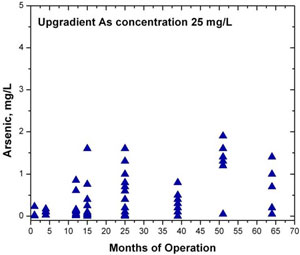
Figure 2. Plot showing trends in arsenic concentra- tions within the PRB over time.
The pH and Eh within the PRB show trends that are expected as water reacts with the ZVI. For example, the pH of groundwater entering the PRB ranges from 6.1 to 6.5, whereas the pH of groundwater within the PRB has increased to as high as 10.8. Similarly, the Eh of groundwater entering the PRB ranges from about 130 to 220 millivolts (mV) whereas Eh values within the PRB range from about 140 mV to -380 mV. The lowest Eh values (highly reducing) were recorded within the first four months of operation; after about one year and continuing through the fifth year of operation, Eh values of groundwater within the PRB increased to a range more typical for a ZVI system (100 to -250 mV) and have since remained relatively static. Limited changes in pH and Eh in other portions of the PRB can be attributed to high velocity and short residence time of the groundwater.
Geochemical parameters of groundwater within the PRB have generally reflected the intended interactions with ZVI, although unexpectedly high concentrations of dissolved organic carbon (DOC) were measured over the first four months of PRB operation. This was attributed to carbon remaining from guar bioslurry used during PRB construction to create a hanging wall that would stabilize the trench. The residual bioslurry also caused difficulty in filtering samples (using 0.45-micrometer disc filters) during the first two sampling events and generated a somewhat foul odor. After 12 months, however, DOC concentrations decreased to near background levels (mean value of 0.9 mg/L). After 15 months, DOC concentrations in the PRB were indistinguishable from concentrations upgradient of the PRB (mean value 0.5 mg/L).
Water level measurements indicate that the PRB has not affected the water table elevation, which varied seasonally by about 1 meter between June 2002 (three years prior to PRB installation) and September 2010 (five years after PRB installation). Overall, the water table has remained below the top of the ZVI across the PRB, as desired in order to capture the vertical extent of the target plume. Negligible evidence of groundwater mounding has been observed upgradient of the PRB, which suggests that the PRB is not significantly impeding groundwater flow.
Results of pneumatic slug tests conducted 5 and 16 months after PRB completion suggest that corrosion and mineral precipitation have had no impact on the area�s hydraulic conductivity. Borehole flowmeter data also have indicated that the hydraulic conductivity of the PRB is generally equal to or greater than that of the aquifer in most subsurface intervals. Based on a 2008 tracer test and subsequent modeling, residence time of groundwater within the PRB is three days with an estimated velocity of 0.035 meters per day. With one exception, the bromide tracer was observed at all well locations.
At monitoring well EPA09, located immediately downgradient of the PRB, sampling after 12, 15, and 25 months of PRB operation identified total dissolved arsenic concentrations of 27.3 mg/L, 22.6 mg/L, and 15.5 mg/L, respectively. Considering the low arsenic concentrations measured within the PRB during the first sampling event (at month 1), the elevated concentrations at 15 and 25 months were unexpected. Consequently, detailed depth-resolved sampling was conducted at this well shortly after each of the two sampling events.
Depth-resolved sampling indicated that arsenic concentrations were significantly reduced from the water table down to a depth of about 41 feet below ground surface (bgs). Arsenic concentrations in this shallow aquifer interval were 0.007 to 0.065 mg/L and generally coincided with concentrations within the reactive medium. Samples taken at 41 to 46 feet bgs showed arsenic concentrations of about 20-30 mg/L. These results indicate that groundwater is moving beneath the PRB and transporting arsenic across the plane of the PRB. In the upper region of the aquifer where groundwater is moving through the PRB, an estimated 99% arsenic removal is achieved.
Arsenic mass flux entering the PRB ranges from 0.5 to 16.9 grams/day/meter2 with a maximum value at a depth of about 40 feet bgs. Above 40 feet bgs, the flux of arsenic downgradient of the PRB ranges from 0.01 to 2 grams/day/meter2. Arsenic mass flux is significantly reduced downgradient of the PRB from the groundwater table to a depth of about 40 feet bgs. Deeper in the aquifer, where emplacement of ZVI was incomplete, there is no indication that arsenic transport is being impacted.
Based on the original design estimates, replenishment of the ZVI would be needed in 2015 in order for the PRB to remain effective. EPA's Region 8 office is now determining suitability of a full-scale PRB that could include the replenished pilot-scale structure. Full-scale implementation would require emplacement of ZVI at a greater depth that extends to the underlying confining (ash tuff) layer. The design also would need to consider the high flux zone below 40 feet bgs and the full width of the arsenic plume.
RESOURCES
CLU-IN Website: Permeable Reactive Barriers, Permeable Treatment Zones, and Application of Zero-Valent Iron
This remediation technology area of CLU-IN provides an overview and compendium of guidance materials, application reports, and training or other tools for designing, installing, and monitoring PRBs.
Federal Remediation Technologies Roundtable (FRTR): Cost and Performance Case Studies
The FRTR maintains a searchable database currently containing 21 case studies on remediation demonstration projects involving PRBs as the primary technology.
Interstate Technology & Regulatory Council (ITRC): Permeable Reactive Barrier: Technology Update
This 2011 technical/regulatory guidance compiled by the ITRC provides updated information about designing and using PRBs to treat contaminated groundwater.
Upcoming Training: Permeable Reactive Barrier: Technology Update
The ITRC offers Internet-based training open to the public on October 11, 2012. Online registration for the 1 hour and 15-minute class opens in early September.
Contact Us:
Suggestions for articles in upcoming issues of Technology News and Trends may be submitted to
Linda Fiedler via email at fiedler.linda@epa.gov.
Past Issues:
Past issues of the newsletter are available at http://www.clu-in.org/products/newsltrs/tnandt/.
Archives | Subscribe | Change Your Address | Unsubscribe
