Environmental Geophysics
General Crosshole Procedures
Introduction
The primary purpose of obtaining crosshole data is to obtain the most detailed in situ seismic wave velocity profile for site-specific investigations and material Characterization. Crosshole velocity data are valuable for assessing man-made materials, soil deposits, or rock formations.
The seismic technique determines the compressional (P-) and/or shear (S-) wave velocity of materials at depths of engineering and environmental concern where the data can be used in problems related to soil mechanics, rock mechanics, foundation studies, and earthquake engineering. Crosshole geophysical testing is generally conducted in the near surface (upper hundred meters) for site-specific engineering applications (Sirles and Viksne, 1990). All of the dynamic elastic moduli of a material can be determined from knowledge of the in situ density, P-, and S-wave velocity. Therefore, since procedures to determine material densities are standardized, acquiring detailed seismic data yields the required information to analytically assess a site. Low-strain material damping and inelastic attenuation values can also be obtained from crosshole surveys. However, the most robust application of crosshole testing is the ability to define in situ shear-wave velocity profiles for engineering investigations associated with earthquake engineering (Mooney, 1984).
The objective of acquiring crosshole data can be multipurpose; that is, the seismic velocity results obtained may be used for evaluation of lateral and vertical material continuity, liquefaction analyses, deformation studies, or investigations concerning amplification or attenuation of strong ground motion. Typically, crosshole surveys are a geophysical tool for performing explorations during what are considered phase two field investigations (where phase one field investigations include surface geophysical surveys, follow-up drilling, trenching, and sampling of the in situ materials). During phase two field exploration, the information gathered is more critical to the analytical site-specific Characterization. Although both phase one and phase two results are important, the two independent sets of data must be integrated into the final analysis.
Crosshole techniques are most useful when phase one site explorations indicate horizontal and particularly vertical variability of material properties. When layers of alternating density or stiffness are either known to exist or are encountered during phase one field investigations, crosshole seismic tests are recommended to define the in situ velocities within each layer. Acquiring crosshole seismic data resolves hidden layer velocity anomalies that cannot be detected with conventional surface methods, allows both final interpretation of other surface geophysical data (seismic or electrical), and permits both empirical and theoretical correlation with other geotechnical material parameters.
In order to have quantitative and quality assured results, crosshole tests performed for either engineering or environmental problems should be conducted in accordance with procedures established by the American Society for Testing and Materials (ASTM). Crosshole seismic test procedures are outlined in ASTM test designation D4428 M-84 (1984). The ASTM procedures provide specific guidelines for borehole preparation, data acquisition, and data reduction/ interpretation. Based on 10 years of experience, since the inception of the ASTM standard in 1984, crosshole geophysical surveys have become more widely used and accepted for engineering as well as environmental applications. Coupling detailed site information obtained from the crosshole tests with the overall acceptance of the validity of the velocity data, these standards use both empirical correlations for liquefaction and specific input parameters for deformation or ground motion analyses (U.S. Bureau of Reclamation, 1989).
Theory
Crosshole testing takes advantage of generating and recording (seismic) body waves, both the P- and S‑waves, at selected depth intervals where the source and receiver(s) are maintained at equal elevations for each measurement. Figure 1 illustrates a general field setup for the crosshole seismic test method. Using source-receiver systems with preferential orientations in tandem (i.e., axial orientations, which complement the generated and received wave type/signal) allows maximum efficiency for measurement of in situ P- or S-wave velocity depending on the axial orientation. Due to the different particle motions along the seismic ray path, it is crucial to use optimal source-receiver systems in order to best record crosshole P- or S-waves (Hoar, 1982). Because only body waves are generated in the source borehole during crosshole tests, surface waves (ground roll) are not generated and do not interfere with the recorded body-wave seismic signals.
Stokoe (1980) demonstrated that particle motions generated with different seismic source types used during crosshole testing are three-directional. Therefore, three-component geophones with orthogonal orientations yield optimal results when acquiring crosshole P- and/or S‑wave seismic signals. With three-component geophones, there is one vertically oriented geophone and two horizontal geophones. For crosshole tests, one horizontal geophone remains oriented parallel to the axis between the boreholes (radial orientation), and the other one remains oriented perpendicular to the borehole axis (transverse orientation). In this case, the two horizontal axis geophones must remain oriented, radially and transversely, throughout the survey. This is accomplished with loading poles or with geophones that can be electronically oriented.
P-waves are generated with a sparker or small explosive device (one that will not damage the PVC casing) such that along the assumed straight-ray propagation path the seismic impulse compresses and rarefies the materials radially toward the receiver borehole(s). Experience has proven that for optimal measurement of the P-wave signal, a hydrophone has the greatest pressure-pulse sensitivity for compressional-wave energy. Also, hydrophones do not need to be clamped against the borehole wall; however, water must be present in the receiver borehole in order to couple the hydrophone to the casing/formation.
For either surface or crosshole seismic testing in unconsolidated materials, P-wave velocity measurements are greatly affected by the moisture content or percent saturation (Allen, Rit, and Woods, 1980). In crosshole testing, the seismic measurements encroach closer to the water surface with each successive depth interval. As the vadose zone and water surface are encountered, P-wave velocities become dependent upon the percent saturation, and the Poisson's ratio is no longer a valid representation of the formation characteristics.
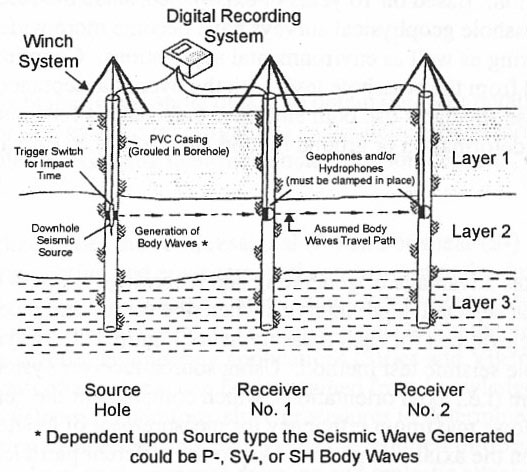
Figure 1. Schematic of crosshole method.
(e.g., Poisson's ratio increases to 0.48-0.49 in 100% saturated soils). Hence, below the water surface, the P-wave is commonly termed the fluid wave, because its propagation velocity is governed by the pore fluid(s), not the formation density. Fluid-wave velocities in fresh water range from 1,400 to 1,700 m/s, depending upon water temperature and salt content.
S-waves generated in crosshole testing may be split into two wave types, each with different particle motions--SV- and SH-waves, vertical or horizontal particle motions, respectively. Shear waves have the unique capability of polarization, which means that impacting the material to be tested in two directions (up or down, left or right) yields S-wave signals that are 180° out of phase. A seismic source with reversible impact directions is the key factor for quality crosshole S-wave data acquisition and interpretation. Figure 2 shows a series of crosshole SV-waves with reversed polarity (note the low amplitude of the P-wave energy compared to the S-wave energy) received at both receiver boreholes.
Typically, the S-wave generated in most crosshole testing is the SV-wave, which is a vertically polarized horizontally propagating shear wave. That is, the ray path is horizontal but the (shear) particle motion along the ray path is in the vertical plane. These SV-waves are easiest to generate because of commercially available borehole impact hammers that have reversible impact directions (up or down), and they are also the easiest to record because only one vertically oriented geophone is required in each receiver borehole. Alternatively, SH-waves can be generated and recorded in crosshole testing. SH-waves also propagate horizontally, but their (shear) particle motion is in the horizontal plane (i.e., horizontally polarized horizontally propagating S-waves). Therefore, in order to generate and record SH-wave signals, horizontal impacts and geophones are required; also, the orientation of the source and receiver must be parallel while their respective orientation remains perpendicular to the axis of the boreholes (transverse orientation).
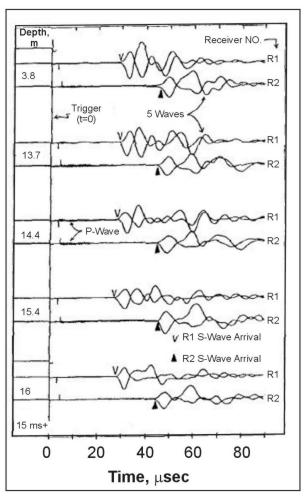
Figure 2. Crosshole SV-wave paired borehole records at five depths.
Theoretically, there is no difference in the body wave velocity for SV- and SH-waves, which justifies use of the uncomplicated vertical source for generation of SV-waves, and vertically oriented geophones for signal detection. There are studies, however, which indicate significant velocity dependence of the SV- and SH-waves due to anisotropic states of stress in either the horizontal or vertical stress field (particularly in soil deposits; (Redpath, et al., 1982) or fractured rock formations (White, 1983).
The requirement for multiple drill holes in crosshole testing means that care must be taken when completing each borehole with casing and grout. ASTM procedures call for PVC casing and a grout mix that closely matches the formation density. Basically, borehole preparation and completion procedures are the success or failure of crosshole seismic testing. Poor coupling between the casing and the formation yields delayed arrival times and attenuated signal amplitudes, particularly for (higher frequency) P-waves. Matching the formation density with a grout mix is not too difficult, but in open coarse-grained soils, problems arise during grout completion with losses into the formation. Even small grout takes begin to affect the velocity measured between two closely spaced drill holes. Several techniques to plug the porosity of the surrounding formation are commercially available (e.g., cotton-seed hulls, crushed walnut shells, or increased bentonite concentration in the grout mix). It should be recognized that increasing the ratio of bentonite/cement within the grout mix does affect density, but so long as the mix sets and hardens between the casing and in situ formation, quality crosshole seismic signals will be obtained..
Another critical element of crosshole testing, which is often ignored, is the requirement for borehole directional surveys. There are several very good directional survey tools available that yield detailed deviation logs of each borehole used at a crosshole site. Borehole verticality and direction (azimuth) measurements should be performed at every depth interval that seismic data are acquired. With the deviation logs, corrected crosshole distances between each borehole may be computed and used in the velocity analysis. Since seismic wave travel times should be measured to the nearest tenth of a millisecond, relative borehole positions should be known to within a tenth of a foot. Assuming that the boreholes are vertical and plumb leads to computational inaccuracies and ultimately to data that cannot be quality assured.
Data Acquisition
Recording instruments used in crosshole testing vary considerably, but there are no standard requirements other than exact synchronization of the source pulse and instrument trigger for each recording. Crosshole measurements rely considerably on the premise that the trigger time is precisely known as well as recorded. The recorded trigger signal from zero-time geophones or accelerometers mounted on the downhole impact hammer allows accurate timing for the first arrival at each drill hole. This becomes uniquely critical when only two drill holes are used (i.e., source and one receiver) because there is no capability of using interval travel times; in this case, the velocity is simply determined through distance traveled divided by direct travel time. Utilizing digital recording equipment affords the operator the ability to store the data on magnetic media for analysis at a later date; but more importantly, digital data can be filtered, smoothed, and time-shifted during analysis. Also, digital signal processing may be directly performed for coherence, frequency-dependent attenuation, and spectral analysis.
Numerous studies have shown that the effects on crosshole measurements by the choice of geophone are not critical to the results (e.g., Hoar, 1982). There are only two requirements for the receivers: the receiver (velocity transducer) must have a flat or uniform output response over the frequency range of crosshole seismic waves (25 to 300 Hz); and, a clamping device must force the receiver against the borehole wall such that it is not free-hanging. The clamping device should not affect the mechanical response of the geophone (i.e., resonance), nor should the uphole signal wire. If an SH-wave source is selected, then horizontal geophones must be used and oriented as previously described to detect the SH-wave arrivals. It is paramount that the polarity of each geophone be known prior to data acquisition because the direct arrivals of S-waves with reversed polarity can be easily misinterpreted. Hoar (1982) provides an excellent description of picking P- and S-wave arrivals off recorded crosshole signals. Hoar's dissertation shows that with proper borehole completion, digital recording equipment, and a preferential source-receiver system, clean reversed polarized and interpretable S-wave signals are relatively easy to acquire.
Data Interpretation
For interpretation of direct ray path travel times between two or three boreholes, the Bureau of Reclamation (Sirles, Custer, and McKisson, 1993) has published a computer program that is designed specifically for reducing crosshole seismic data. Furthermore, the program was fashioned around the ASTM conventions and test procedures outlined for crosshole seismic testing. The program CROSSIT (Version 2.0) is intended to be a step-by-step program that allows the user to:
a) Input lithologic information obtained from geologic drill hole logs.
b) Input deviation survey for each drill hole.
c) Input travel times for P- and/or S-wave arrivals at one or two receiver holes.
d) Enter site-specific information (location, surface elevation, etc.).
e) Map each borehole using deviation survey information.
f) Determine corrected crosshole distances between respective drill shot pairs: source/receiver 1, source/receiver 2 and receiver1/receiver2.
g) Compute direct P- and S-wave velocities from travel time data.
h) Tabulate and/or graph (to hard copy or disk file).
i) Borehole directional survey data and plots.
j) P- and S-wave velocity depth profiles from each drill hole pair.
k) Interactively edit input or graphical files and combine data sets.
l) Post-process seismic data and/or plots for alternative uses.
CROSSIT is built for compatibility with laptop or desktop computers and dot matrix or laser-jet printers such that data reduction could be performed in the field as geophysical data are being acquired. The logic and flowt for this interpretation and data presentation program are designed to follow the typical field data acquisition process (i.e., geologic information, borehole information, travel-time information) to permit interactive computer analysis during data collection. This technique of reducing data in the field has proven its value because of the ability to determine optimal testing intervals and adjust the program as necessary to address the site-specific problem.
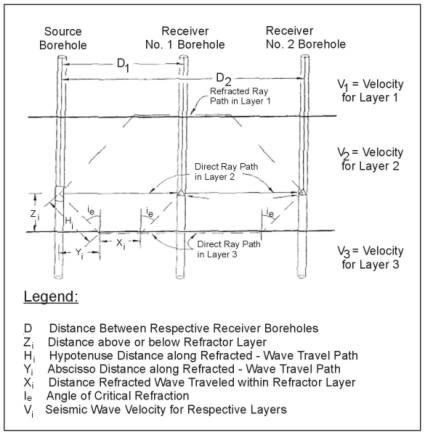
Figure 3. Illustration of refracted ray path geometries in crosshole seismic tests where V1 > V2 < V3 and V1 < V3.
Unlike surface seismic techniques, crosshole testing requires a more careful interpretation of the waveforms acquired at each depth. For example, in crosshole testing, the first arrival is not always the time of arrival of the direct ray path. As illustrated schematically in figure 3, when the source and receivers are located within a layer that has a lower velocity than either the layer above or below it (this is termed a hidden layer in refraction testing), refracted waves can be the first arrivals. Both the source/receiver distance above or below the high-velocity layer and the velocity contrast (V1 : V2) across the seismic interface determine if the refracted wave will arrive before the direct wave. Due to the effect refracted waves have on crosshole data sets, ASTM procedures require a three-borehole array because velocity corrections can be made for refracted arrivals. Also, depending upon the velocity contrast across layer boundaries, direct arrivals through low-velocity layers are generally larger amplitude and thereby recognizable. This permits timing direct arrivals directly off the waveform. Figure 4 shows an example of (SV-) direct-wave arrivals and refracted-wave arrivals where the arrival time of the direct wave (slower) can be picked later in the waveform behind the low-amplitude refracted-wave arrival. In this example, refractions occur in a situation similar to that depicted in figure 3; that is, refractions occur from high-velocity materials either above or below the low-velocity layer.
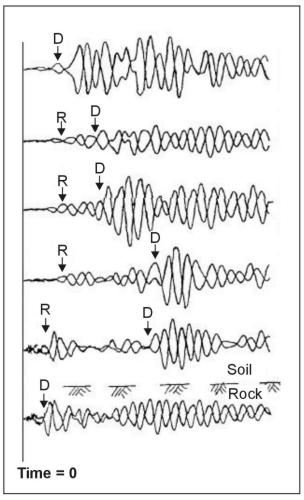
Figure 4. Crosshole SV-waves showing direct (D) and refracted (R) arrivals.
When approaching seismic interfaces, refracted-wave arrivals begin to be timed as the first arrival, which could (easily) be misinterpreted as direct-wave arrival. Therefore, the following sequence of eight steps (equations) will confirm detection of refracted-wave travel time or direct-wave travel time at each recording depth (ASTM 1984):
Compute ic: sin ic = V1/V2
Compute hypotenuse distance Hi: H1 = H2 = H3 = Z/cos ic
Compute abscissa distance Yi: Y1 = Y2 = Y3 = Ztan ic
Compute travel times through both materials:
tV1 = 2H1 / V1
tV2 = (D1 - 2Y1) / V2
[V1 and V2 are known from measurement above and below the seismic interface.]
Compute total refracted travel time: Trfr = tV1 + tV2
Compute total direct travel time: Tdir = D1 / V1
Retrieve measured crosshole travel time: Tmeas
Compare Trfr with Tdir and Tmeas
IF: Trfr Tdir = Tmeas THEN: True V1
IF: Trfr Tmeas < Tdir THEN: Apparent V1 (refracted velocity)
Comparing both sets of direct wave velocities, that is, source to receiver No. 1 (V(R1)) and source to receiver No. 2 (V( R2)), with the interval velocity (VI) computed from
Internal velocity V1 = (D2 - D1)/(Tmeas(R2) - Tmeas(R1)),
allows easy identification of boundaries with velocity contrasts. When VI is much greater than the two computed direct-wave velocities, then refracted-wave arrivals are being timed as first arrivals at the second receiver borehole. Therefore, a systematic comparison of measured travel times, computed direct velocities, and interval velocities at each recording depth enables interpretation of true in situ velocity at all measurement depths. For crosshole tests, Butler, et al. (1978) developed a computer program that performs this comparison of the respective computed velocities determined at every depth. Based on this discussion, to ensure that true in situ velocities are presented, crosshole measurements should be performed a minimum of four measurement intervals below the zone of concern to adequately define the velocity profile.
The comparative technique for defining the refractor velocities outlined above assumes that the velocities are constant within each layer; however, occasionally this is an oversimplification. Some deposits have linearly increasing velocity with depth, primarily due to vertical pressures, where the apparent velocity for each depth can be computed with
Vapp(z) = Vi + Kz
In these cases, Vapp is a function of depth (z), Vi is the initial velocity at zero depth, and K is the increase in velocity per unit depth. Direct-wave velocities computed for the far receiver (R2) at each depth will always be slightly higher than the near receiver (R1); hence, the interval velocity will be even higher. Increasing velocity with depth implies the seismic ray path is nearly circular between source and receiver, thereby sensing deeper (higher velocity) material as the source-receiver separation increases. The effect of increasing velocity with depth is greatest within thick homogeneous soil deposits. In these soil conditions, computing an average velocity from the two direct velocities (i.e., Vave = (V(R1) + V(R2))/2) is often the best estimate for presenting the in situ velocity profile.
Modeling and Data Processing
Typically, either forward or inverse modeling for cross-borehole seismic investigations consists of computing synthetic travel times to test the ray path coverage and resolution of either unknown or identified velocity anomalies, respectively. For engineering applications, there is not much advantage in determining (via modeling) the ray coverage or residual velocity resolution because crosshole testing at the engineering scale utilizes a simple horizontal, straight-ray path geometry to determine average velocity. Also, lithologic information such as stratigraphy and material type are determined from the drilling and sampling program prior to seismic data acquisition; this allows reliable constraints, or boundary conditions, to be placed on the field data along the boundaries of the material between the boreholes.
For engineering applications, digital signal processing in crosshole seismic tests is, similar to modeling, of minimal value. This, of course, assumes field data are acquired properly and no analog filtering or digital aliasing was performed prior to recording seismic data from each depth. There are a number of digital signal processing techniques useful for determining material properties other than P- or S-wave velocity, as well as confirming the computed crosshole velocity profile, such as:
a) Spectral analysis for determination of inelastic constants (attenuation and/or material damping).
b) Frequency analysis for correlation of phase and group velocity.
c) Cross-correlation of recorded seismic signals from one receiver to another receiver borehole, or source to receiver coupling for signal coherence.
Sophisticated processing is rarely required in (engineering) crosshole testing, and the straightforward distance/travel time relationship for velocity computations is considered functional and effective
Advantages and Limitations
Crosshole seismic testing has the unique advantage of sampling a limited volume of material at each test depth. Thus, the final result is a significantly more detailed and accurate in situ seismic (P- and/or S-wave) velocity profile. Crosshole tests are not unique in the use of preferential source/receiver configurations; however, there is the distinctive opportunity to generate and record only body wave energy, as well as preferentially excite particle motion in three directions with respect to the vertical borehole wall. Because of this, the crosshole test permits much easier interpretation of direct arrivals in the recorded waveforms. Because boreholes are required, there is the opportunity to obtain more site-specific geotechnical information, which, when integrated with the seismic data, yields the best assessment for the engineering application (liquefaction, deformation, or strong motion Characterization). Also, because each drill hole was cased for the crosshole tests, additional geophysical surveys should be conducted. Typically, geophysical borehole logging will be conducted in each drill hole for the purpose of defining lithologic and stratigraphic continuity of the deposits.
Crosshole seismic testing has the definitive advantage of assessing a complex layered velocity structure with alternating high and low relative velocities. Other surface techniques such as spectral analysis of surface waves can theoretically evaluate the high/low layered velocity structure, but due to a number of inherent assumptions associated with surface geophysical methods, several non-unique velocity profiles may be derived (from inverse modeling) without specific information about the subsurface layering at the site. Since considerable confidence can be placed on engineering scale crosshole seismic data, computation of in situ low-strain elastic constants (Shear and Young's modulus, Poisson's ratio, etc.) permits dependable assessment of geotechnical parameters for the site-specific evaluation. Recently, sites of particular concern for obtaining P- and S-wave velocities are liquefaction studies where the subsurface contains considerable unconsolidated coarse-grained material, and standard geotechnical test procedures (blow counts and material sampling) cannot effectively evaluate in situ properties. For successful engineering analysis of coarse-grained materials, crosshole testing is one of the most acceptable geophysical techniques available.
The primary detriments or obstacles encountered during crosshole testing are typically related to the placement and completion of multiple drill holes. Sites where noninvasive techniques are required due to hazardous subsurface conditions, crosshole seismic tests are not applicable because of tight regulatory procedures regarding drilling, sampling, and decontamination. However, at sites where detailed in situ P- and S-wave velocities are required, drill hole completion must follow ASTM procedures, and when unusual conditions exist (e.g., open-work gravels), specialized techniques for borehole completion should be employed. The U.S. Bureau of Reclamation has encountered numerous sites in the western United States where loose, liquefiable sand and gravel deposits needed to be investigated, and crosshole testing effectively evaluated the in situ material density and stiffness with P- and S-wave velocities, respectively; however, considerable care and caution were used for completion of each borehole (U.S. Bureau of Reclamation, 1992).
Seismic data for crosshole testing need considerably more waveform interpretation because refraction events from high-velocity layers either above or below a low-velocity layer must be identified and the first-arrival velocity corrected. Direct-wave arrivals are easily recognized (even with low-amplitude refracted arrivals) as long as the previously described field equipment is utilized for preferential generation of P-waves or polarized SV or SH-waves. The ASTM requirement of three drill holes seems costly to a project budget; however, the necessary source/receiver configurations and borehole separation allow optimal correction and evaluation of in situ P- and S-wave velocities for each material layer at depth.
Example Problem
To illustrate the effect of a high S-wave velocity layer overlying a low S-wave velocity layer on crosshole waveforms, the following sample problem is presented using data acquired at a site in central Utah. Figure 5 shows a portion of the waveforms collected over the depth interval 17.5 to 32.0 m, as well as the entire S-wave velocity profile obtained at this site. Only one polarity of the S-waves obtained is plotted over this depth interval (unlike the opposite polarity data shown in figure 4), but the arrival of the S-wave is clearly distinguished from the lower-amplitude and higher-frequency P-wave arrival.
The objective of this investigation was to determine if a low-velocity alluvial layer exists beneath the embankment, which was constructed in 1943. Data are then used to determine the liquefaction potential of the foundation alluvial deposits. As clearly shown on the sample problem figure, directly beneath the embankment the velocities decrease to less than 240 m/s in a layer of lean clay, which is not considered liquefiable; however, within the silty sand alluvial deposits, the wave forms show considerable increase in the S-wave travel times, and the computed velocities indicate potentially liquefiable deposits with S-wave velocities less than 180 m/s. Beneath approximately 30 m, the S-wave velocities gradually increase to greater than 240 m/s.
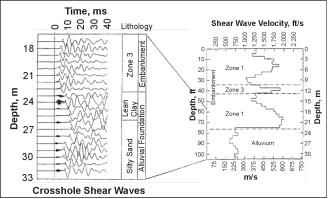
Figure 5. Example problem.
This sample problem, or example data set, illustrates three distinct advantages that crosshole testing has over conventional surface geophysical testing for these types of investigations:
a) Ease of identification of direct arrival S-waves.
b) Ability to determine the presence of low-velocity materials (alluvium) directly beneath high-velocity materials (embankment).
Direct and fairly straightforward computation of the S-wave velocity profile, which is correlated with the liquefaction potential of both the materials and depth intervals of engineering concern for the safety of the structure.
The pages found under Surface Methods and Borehole Methods are substantially based on a report produced by the United States Department of Transportation:
Wightman, W. E., Jalinoos, F., Sirles, P., and Hanna, K. (2003). "Application of Geophysical Methods to Highway Related Problems." Federal Highway Administration, Central Federal Lands Highway Division, Lakewood, CO, Publication No. FHWA-IF-04-021, September 2003. http://www.cflhd.gov/resources/agm/
