Environmental Geophysics
General In-Hole Procedures
Introduction
Borehole geophysics, as defined here, is the science of recording and analyzing measurements in boreholes or wells, for determining physical and chemical properties of soils and rocks. The purpose of this section is to provide the basic information necessary to apply the most useful geophysical well logs for the solution of problems in groundwater, the environmental field, and for engineering applications. Some of the objectives of geophysical well logging are:
- Identification of lithology and stratigraphic correlation.
- Measuring porosity, permeability, bulk density, and elastic properties.
- acterizing fractures and secondary porosity.
- Determining water quality.
- Identifying contaminant plumes.
- Verifying well construction.
Although the U.S. Government and some private industry have been converting to the metric system for logging equipment and log measuring units, the inch-pound (IP) system is still standard in the United States. In this manual, the IP system is used where IP is the standard for presently used equipment.
Benefits
The main objective of borehole geophysics is to obtain more information about the subsurface than can be obtained from drilling, sampling, and testing. Although drilling a test hole or well is an expensive procedure, it provides access to the subsurface where vertical profiles or records of many different kinds of data can be acquired.
Geophysical logs provide continuous analog or digital records of in situ properties of soils and rocks, their contained fluids, and well construction. Logs may be interpreted in terms of lithology, thickness, and continuity of aquifers and confining beds; permeability, porosity, bulk density, resistivity, moisture content, and specific yield; and the source, movement, chemical and physical characteristics of groundwater and the integrity of well construction. Log data are repeatable over a long period of time, and comparable, even when measured with different equipment. Repeatability and comparability provide the basis for measuring changes in a groundwater system with time. Changes in an aquifer matrix, such as in porosity by plugging, or changes in water quality, such as in salinity or temperature, may be recorded. Thus, logs may be used to establish baseline aquifer characteristics to determine how substantial future changes may be or what degradation may have already occurred. Logs that are digitized in the field or later in the office may be corrected rapidly, collated, and analyzed with computers.
Some borehole geophysical tools sample or investigate a volume of rock many times larger than core or cuttings that may have been extracted from the borehole. Some probes record data from rock beyond that disturbed by the drilling process. Samples provide point data from laboratory analysis. In contrast, borehole logs usually are continuous data, and can be analyzed in real time at the well site to guide completion or testing procedures. Unlike descriptive logs written by a driller or geologist that are limited by the authors' experience and purpose and are highly subjective, geophysical logs may provide information on some acteristic not recognized at the time of geophysical logging. Data from geophysical logs are useful in the development of digital models of aquifers and in the design of groundwater supply, rege, or disposal systems. A log analyst with the proper background data on the area being studied can provide reasonable estimates of hydraulic properties needed for these purposes. Stratigraphic correlation is a common use of geophysical logs; logs also permit the lateral extrapolation of quantitative data from test or core holes. Using logs, a data point in a well can be extended in three dimensions to increase its value greatly. Many techniques used in surface geophysics are related closely to techniques in borehole geophysics, and the two are considered together when setting up comprehensive groundwater, environmental, or engineering investigations. Geophysical logs, such as acoustic‑velocity and resistivity, can provide detailed profiles of data that are useful in interpreting surface surveys, such as seismic and resistivity surveys.
Limitations
Geophysical logging cannot replace sampling completely, because some information is needed on each new area to aid log analysis. A log analyst cannot evaluate a suite of logs properly without information on the local geology. Logs do not have a unique response; for example, high gamma radiation from shale is indistinguishable from that produced by granite. To maximize results from logs, at least one core hole should be drilled in each depositional basin or unique aquifer system. If coring the entire interval of interest is too expensive, then intervals for coring and laboratory analysis can be selected on the basis of geophysical logs of a nearby hole. Laboratory analysis of core is essential either for direct calibration of logs or for checking calibration carried out by other means. Calibration of logs carried out in one rock type may not be valid in other rock types because of the effect of chemical composition of the rock matrix.
In spite of the existence of many equations for log interpretation and ts that provide values like porosity, log analysis still is affected by many variables that are not completely understood. Correct interpretation of logs is based on a thorough understanding of the principles of each technique. For this reason, interpretation of logs in the petroleum industry largely is done by professional log analysts. In contrast, very few log analysts are working in the environmental and engineering fields, so interpretation of logs for these applications often is carried out by those conducting the investigation.
A thorough understanding of the theory and principles of operation of logging equipment is essential for both logging operators and log analysts. An equipment operator needs to know enough about how each system works to be able to recognize and correct problems in the field and to select the proper equipment configuration for each new logging environment. A log analyst needs to be able to recognize malfunctions on logs and logs that were not run properly. The maximum benefit is usually derived from a logging operation where operators and analysts work together in the truck to select the most effective adjustments for each log.
Cost
The cost of logging can be reduced significantly by running only those logs that offer the best possibility of providing the answers sought. Further reductions in cost can be achieved by logging only those wells that are properly located and constructed to maximize results from logging. In contrast, more money needs to be spent on log analysis. More time may be required to analyze a suite of logs for maximum return than to run the logs. Too often, this time is not budgeted when the project is planned.
Planning a Logging Program.
A logging program must be properly planned to be of maximum benefit. Borehole geophysics is frequently applied to environmental investigations, such as hydrogeology to aid site selection, monitoring, determining well construction, and planning remediation. In planning a logging program for environmental applications, one of the most difficult questions to answer is what geophysical logs will provide the most information for the funds available. There are several important questions in the decision-making process.
a) What are the project objectives?
b) What is the hydrogeology of the site?
c) How will test holes be drilled and wells constructed?
d) Who will do the logging and log analysis?
e) What are the financial limitations, and how else might some of these data be obtained?
The log selection process needs to start at the time of the initial work plan.
In addition to selecting the general types of logs to be run, many varieties of some logging tools exist (e.g., resistivity, flowmeter, and caliper). The basic information needed to simplify the selection process among the more commonly used logs is provided in a chart in figure 1 (Keys, Crowder, and Henrich, 1993). Decisions on what logs to be run should not be based on this table alone. The chart should only be used to select logs that should be investigated further. The logs selected should meet specific project objectives, provide the necessary information in the rock units to be drilled, and consider the planned well construction.
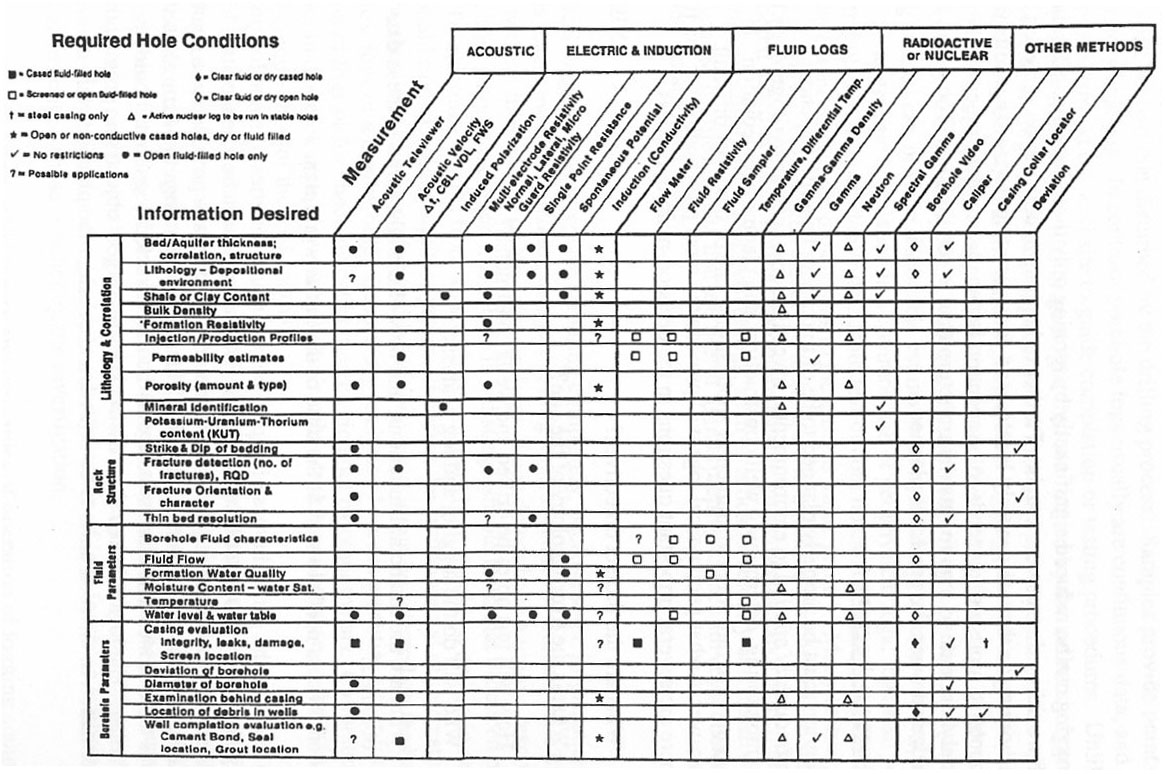
Figure 1. Log selection chart.
Log Analysis
In recent years, computer techniques have dominated log analysis; however, this development has not changed the basic requirements for getting the most information from logs. First, background information on each new hydrogeologic environment is essential where logs are to be used. The amount and kind of background data needed are functions of the objectives of the program. Second, the suite of logs to be run should not only be based on project objectives but also on knowledge of the synergistic nature of logs. Two logs may provide answers that may not be possible with either log separately, and each additional log may add much more to a total understanding of the system. Third, logs need to be selected, run, and analyzed on the basis of a thorough understanding of the principles of each log, even if the final results come out of a computer. The process of log analysis can be simplified into several steps, as follows:
a) Data processing, which includes depth matching, merging all logs and other data from a single well, and editing and smoothing the data set.
b) Correction of borehole effects and other errors.
c) Conversion of log measurements to hydrogeologic and engineering parameters of interest, such as porosity.
d) Combining logs and other data from all wells on a project so the data can be extrapolated laterally in sections or on maps.
Qualitative Analysis
Logs were first used for the identification of rock and fluid types, their lateral correlation, and the selection of likely producing intervals for well completion; these uses are still vital today in many fields. Qualitative log analysis is based mostly on knowledge of the local geology and hydrology, rather than on log-response ts or computer plots. Examination of outcrops, core, and cuttings, coupled with an understanding of log response, will permit the identification and correlation of known aquifers and confining beds.
Lithologic interpretation of logs needs to be checked against data from other sources, because geophysical logs do not have a unique response. This requirement is also true of stratigraphic correlation, where gross errors can be made by just matching the wiggles. Correlation by matching log acter can be done without understanding the response to lithology, but this approach can lead to erroneous results. Even within one depositional basin, the response of one type of log may shift from lateral facies changes.
For example, the feldspar content of a sandstone may increase toward a granitic source area, which probably would cause an increase in the radioactivity measured by gamma logs. This measurement might be interpreted mistakenly as an increase in clay content unless other logs or data were available. For this reason, the synergism of composite log interpretation is stressed in this manual. Logs should be interpreted as an assemblage of data, not singly, to increase the accuracy of analysis.
Accuracy of qualitative interpretation usually improves with an increase in the number of wells that are logged in an area and the amount of available sample data. A gradual change in log response across a depositional basin may indicate a facies change. One anomalous log caused by unusual hole conditions may be identifiable when compared with a number of logs with consistent response; such errors are not likely to repeat. Continuous core or a large number of core samples from one test hole is more useful than a few nonrepresentative samples scattered throughout the section. If continuous coring of one hole cannot be funded, then geophysical logs of a nearby hole can be used to select representative intervals for coring.
Quantitative Analysis
Obtaining quantitative data on aquifers or rocks under dam sites is an important objective of many environmental and engineering logging programs; however, the proper steps to ensure reasonable accuracy of the data often are not followed. The scales on logs in physical units, such as percent porosity and bulk density, in grams per cubic centimeter (g/cc), or resistivity, in Wm, must be determined. Even if the procedures described under log calibration and standardization are followed carefully, corroborating data for the particular rocks and wells logged are needed. Repeatability is ensured by logging selected depth intervals a second time; equipment drift is indicated by changes in response as a function of time or temperature. Because of the effect of rock matrix or specific rock type, calibration in one rock type may not ensure accurate parameter scales in another rock type. For this reason, if the rocks being logged are not the same as those in which the equipment was calibrated, core analyses are needed to check values on the logs. Before any log data are used quantitatively, they must be checked for extraneous effects, such as hole diameter or bed thickness.
Data are of questionable value where hole diameter is significantly greater than bit size, or from intervals where bed thickness is equal to or less than the vertical dimension of the volume of investigation for the probe. The volume of investigation is defined for the purposes of this manual as that part of the borehole and surrounding rocks that contributes 90% of the signal that is recorded as a log. The radius of investigation is the distance from the sensor out to the 90% boundary. These terms do not mean that the volume of investigation is spherical or that the boundary is a sharp cutoff. Instead, a gradual decrease in contribution to the signal occurs with increasing distance from the borehole. The size and shape of the volume of investigation changes in response to varying borehole conditions, the physical properties, and geometry of boundaries in the rock matrix and the source-to-detector spacing. Bed-thickness effects on log response can be best explained using the concept of volume of investigation and its relation to source-to-detector spacing. If a bed is thinner than the vertical dimension of the volume of investigation or thinner than the spacing, the log seldom provides accurate measurement of the thickness or physical properties of that bed because, under these conditions, the volume of investigation includes some of the adjacent beds. From the standpoint of quantitative log analysis, the best procedure is to eliminate from consideration those depth intervals that demonstrate diameter changes that are significant with respect to the hole diameter response of the logging tool.
Both vertical and horizontal scales on logs need to be selected on the basis of the resolution and accuracy of the data required. Logs obtained by large commercial logging service companies generally have vertical scales of 20 or 50 ft/in., which is not adequate for the detail required in many engineering and environmental studies, where the wells may be only about 100 m deep. Similarly, the horizontal scales on many service company logs are compressed to avoid off-scale deflections. Logs digitized in the field will overcome many of these problems, and this subject is discussed in detail later. Some logs may be run too fast for the accuracy and thin bed resolution required. When the detector is centered on the contact between two beds of sufficient thickness, half the signal will be derived from one unit, and half from the other; selection of contacts at half amplitude for nuclear logs is based on this fact. If a nuclear or other slow-responding log is run too fast, contacts will be hard to pick and will be displaced vertically.
Few logs measure the quantity shown on the horizontal scale directly. For example, the neutron log does not measure porosity; it responds chiefly to hydrogen content. The difference between porosity and hydrogen content can lead to a large porosity error where bound water or hydrocarbons are present. Thus, a knowledge of the principles of log-measuring systems is prerequisite to the accurate quantitative analysis of logs.
Synergistic Analysis
Multiple log analysis takes advantage of the synergistic nature of many logs; usually much more can be learned from a suite of logs than from the sum of the logs individually. For example, gypsum cannot be distinguished from anhydrite with either gamma or neutron logs alone, but the two logs together are diagnostic in areas where gypsum and anhydrite are known to exist. They are both very low in radioactive elements, but gypsum has a significant amount of water of crystallization, so it appears as high porosity on the neutron log. In contrast, anhydrite appears as very low porosity on neutron logs. Both minerals will be logged as high resistivity. Computer analysis of logs can be very helpful in identifying such relationships because shading to emphasize differences between logs is easily accomplished.
Examining a suite of logs from a distance is good practice so that significant trends and shifts in response become more obvious in contrast to the detail seen up close. Thus, replotting logs at different vertical or horizontal scales, using a computer, may bring out features not previously obvious. The suite of logs needs to be examined for similarities and differences, and explanations need to be sought for log response that departs from that anticipated, based on the available background geologic data. When searching for explanations for anomalous log response, first examine the caliper log to determine if an increase in borehole diameter offers a possible reason. Although many logs are titled borehole-compensated or borehole-corrected, almost all logs are affected to some degree by significant changes in borehole diameter. All drill holes, except those drilled in very hard rocks like granite, have thin intervals where hole diameter exceeds bit size sufficiently to cause anomalous log response. Logs usually can be corrected for average borehole diameter, but thin zones of different diameter spanned by the logging tool are difficult to correct. Drilling technique can have a major effect on variations in borehole diameter.
Well construction information also may explain anomalous response, as may information on the mineral or chemical composition of the rock. Casing, cement, and gravel pack have substantial effects on log acter. Some logs are designed specifically to provide information on the location and acter of casing and cement. These logs are described in the section on well‑completion logging.
Computer Analysis
Computer analysis of geophysical well logs is now widely used, and if done properly, can contribute significantly to results from log interpretation. The very large amount of data in a suite of well logs cannot easily be collated or condensed in the human mind so that all interrelations can be isolated and used; computer analysis makes this possible. All of the major commercial well‑logging service companies offer digitized logs and computer interpretation. Software packages for log editing and analysis are available that will run on microcomputers with sufficient memory, data storage, and graphics capability. Although the spreadsheet was not designed for log analysis, someone who understands logs can manipulate the data and plot the results (Keys, 1986). They do not, however, offer all of the features and flexibility of a program written specifically for log analysis. Programs written for the analysis of oil well logs have many features not needed for environmental and engineering applications and are often more expensive.
Computer analysis of logs offers a number of advantages over other methods used in the past: a large mass of data can be collated and displayed; logs can be corrected and replotted; scales can be changed; smoothing and filtering operations can be carried out; cross‑plots can be made between different kinds of logs, and between logs and core data; calibration curves, correlation functions, and ratios can be plotted, as well as cross‑section and isopach maps. Finally, these results can be plotted as publication-quality figures at a cost lower than hand plotting. Although all of these manipulations can be carried out by hand, the large quantity of data present in a suite of logs, or in the logs of all wells penetrating an aquifer system, is ideally suited for computer analysis. Figure 2 is a computer-generated cross section of three test holes in the Chicago area. The lithology was entered with key terms capitalized so that a column with lithologic symbols could be automatically generated. The correlation lines were sketched using the program, and shading between logs can also be added, as in figure 3.
Changing the vertical and horizontal scales of logs independently was almost impossible before computer processing was available; now replotting to produce scales best suited for the intended purpose is a simple matter. Correcting for nonlinear response or changing from a linear to a logarithmic scale are also relatively simple procedures. Most probes output a pulse frequency or a voltage that is related to the desired parameter by an equation that can easily be solved using a computer. Data from probe calibration can be entered in the computer to produce a log in the appropriate environmental units. For example, most neutron logs are recorded in pulses per second, which can be converted to porosity if proper calibration and standardization data are available. Other logs that might be computed from raw digital data are differential temperature, acoustic velocity from transit time, and acoustic reflectivity or acoustic caliper.
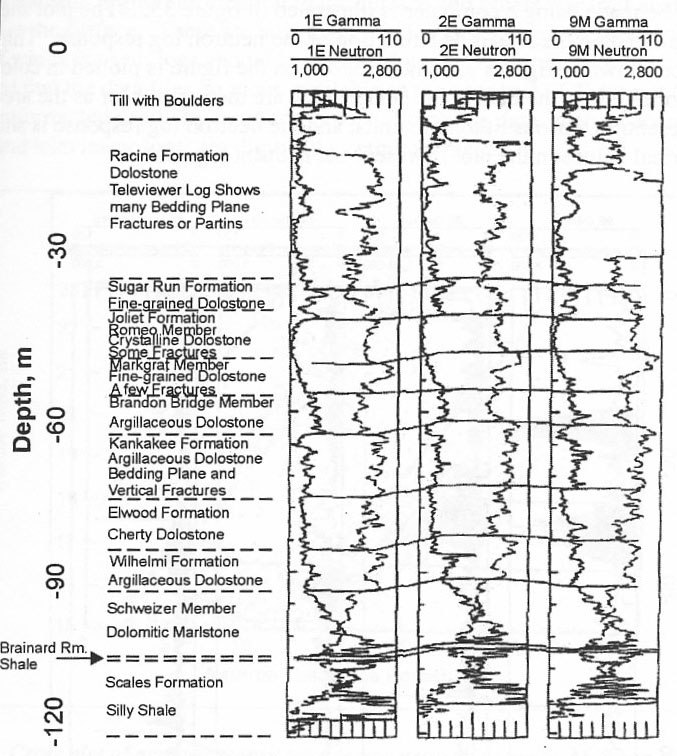
Figure 2. Computer plot of gamma and neutron logs of three test holes in the Chicago area, showing stratigraphic correction based on logs and lithology.
A computer is ideally suited for correcting logs and plotting them with calibrated scales. Depth correction is required on a large number of logs, and it can be carried out at the same time the computer is being used to make the first plot of digitized data. The most common correction needed is a consistent depth shift for the entire log to make it correlate with other logs of the same well or with core data, but stretching of part of a log can also be carried out.
Another important technique for log analysis is the computer plotting of data obtained from logs against data from other logs, core analyses, or tests. The technique most used is the cross plot, which compares the response of two different logs. A cross plot of transit time from the acoustic-velocity log versus porosity from the neutron log, calibrated for limestone, is given in figure 4. Data were plotted from digitized commercial logs of Madison test well No. 1 drilled by the U.S. Geological Survey in Wyoming. The calibration lines labeled sandstone, limestone, and dolomite were obtained from a plot in a book of log interpretation ts provided by the company that did the logging. These two logs indicate that two major rock types are in the interval plotted: limestone and dolomite. The group of points to the right of the dolomite line indicates secondary porosity in the dolomite. Another kind of cross‑plot that can be made using a computer is illustrated in figure 5. The plot shows a third log variable plotted on the Z-axis as a function of the neutron log response. This is the same rock sequence shown in figures 2 and 3. When the figure is plotted in color or displayed on a color monitor, the bars in the center track are the same color as the areas on the cross plot representing various lithologic units, and the neutron log response is shown by colors. The numerical values in the plot represent the neutron log values.
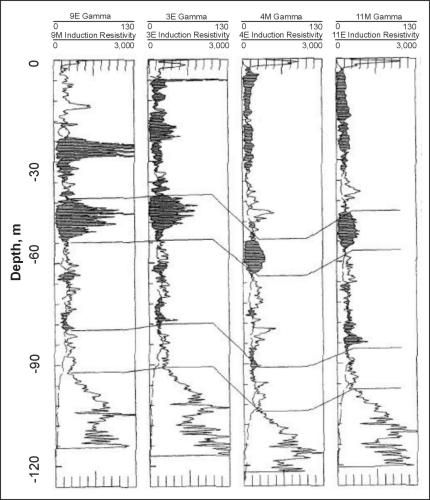
Figure 3. Cross section of four test holes in the Chicago area showing correlation enhanced by computer shading between gamma and induction logs.
Digitizing Logs
Geophysical logs may be digitized at the well while they are being run or subsequently from the analog record. Onsite digitizing is the most accurate and least expensive; with computers now on some logging trucks, real‑time processing of the data may be carried out. Onsite digitizing also provides backup for recovery of data that are lost on the analog recorder because of incorrect selection of scales. Off-scale deflections lost from the analog recorder will be available from the digital record. Some systems permit immediate playback of the digital record to the analog recorder with adjustment of both horizontal and vertical scales. Some probes transmit digital information to the surface and others transmit analog data that are digitized at the surface. There are advantages and disadvantages to both systems but regardless of which is used, logs should be digitized while being run. For most logs, it is recommended that the data files be made available to the user in ASCII format because it can be read and reformatted easily by most computers. Some log data, such as acoustic waveforms and televiewer logs, are digitized in other formats.
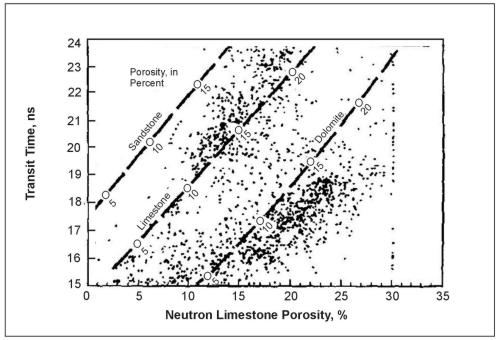
Figure 4. Cross plot of acoustic transit time versus neutron porosity, Madison limestone test well No. 1, Wyoming.
Sample interval and sample time need to be correctly selected for onsite digitizing of logs. Sample intervals of 0.15 m are used widely in both the petroleum industry and in groundwater hydrology; however, for detailed engineering and environmental investigations, intervals as small as 0.03 m are often used. If too many samples of the data are recorded, some samples can later be erased, and they can be averaged or smoothed; if not enough samples are recorded, needed information may be lost. Sample time is the duration of time over which a single sample is reorded. Sample time may be milliseconds (ms) or less for analog voltages, but may be 1 s or longer for pulse signals from a nuclear-logging probe. Digital data may be printed, plotted, or displayed on a computer monitor while the log is being run. An analog display in real time is needed because watching a log develop is one of the best ways to avoid major errors in logging and to optimize probe and data output configuration.
Information on the digital record should be listed on the log heading of the analog plot. This information includes the label on the recording medium, file number, sample interval, time, depth interval recorded, and any calibration information pertinent to the digital record.
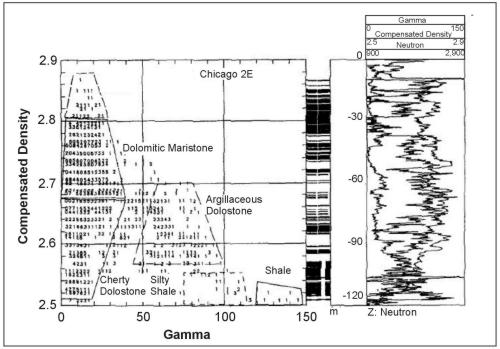
Figure 5. Three-dimensional "Z-plot" of gamma, density, and neutron log response of a test hole in the Chicago area.
Although office digitizing of analog records is expensive and time-consuming, no other choice may exist for old logs. Because of the training needed to digitize logs correctly, particularly multicurve commercial logs, better and less expensive results usually are obtained from a company specializing in digitizing geophysical logs. To have logs digitized commercially, certain specifications or instructions must be provided to the company with the purchase order. The types of logs to be digitized must be listed, along with the specific curve on each log, the depth interval, the sample interval, and vertical and horizontal scales. If editing of logs is to be done, it must be specified, but usually this should be done by the user. In addition to specifying the computer-compatible recording medium, the user can request a printout of all digital data and check plots of the logs. If the check plots are on the same scale as the original, they can be overlaid to verify the accuracy of digitizing.
Borehole Effects
The manner in which a test hole or well is drilled, completed, and tested has a significant effect on geophysical logs made in that well (Hodges and Teasdale, 1991). One of the objectives of logging is to obtain undisturbed values for such rock properties as porosity, bulk density, acoustic velocity, and resistivity, but the drilling process disturbs the rock near the drill hole to varying degrees. Although a number of different types of logging probes are called borehole compensated or borehole corrected, all probes are affected by the borehole to some degree. Borehole effects on geophysical logs can be divided into those produced by the drilling fluids, mud cake, borehole diameter, and well construction techniques. All procedures can be controlled to produce better logs. In some situations, it may be cost effective to drill two holes close together, the first designed to optimize logging, and the second cored in the depth intervals suggested by those logs. Even if drilling and completion techniques are beyond control, their effect on log response can be reduced by proper probe selection and an understanding of borehole effects.
All drill holes, except those drilled in very hard rocks like granite, have thin intervals where hole diameter exceeds bit size sufficiently to cause anomalous log response. From the standpoint of log analysis, the best procedure is to not consider those depth intervals that demonstrate diameter changes that are significant with respect to the hole diameter response of the logging tool.
The difference between a rotary-drilled hole and a nearby core hole in an area where the sedimentary rocks change very little over great distances is shown in figure 6. The core hole was drilled very slowly, with considerable circulation of drilling mud to maximize core recovery. Core recovery was close to 100% in these well-cemented mudstones, sandstones, anhydrite, and dolomite. The coring procedure caused significant variations in borehole diameter, partly because of solution of halite cement and veins during the lengthy drilling process, which included numerous trips with the core barrel. The core hole produced some very poor quality logs. The rotary hole was drilled very rapidly to minimize hole diameter changes. Although increases in hole diameter occurred at the same depths in both holes, the range of diameter was much greater in the core hole. Stratigraphic correlation can be done with caliper logs in this area because hole diameter changes are closely related to rock type. The very sharp deflections just above 60 m are the result of the solution of halite veins. The very rugose interval below 90 m probably is the result of thin-bedded layers of anhydrite and mudstone.
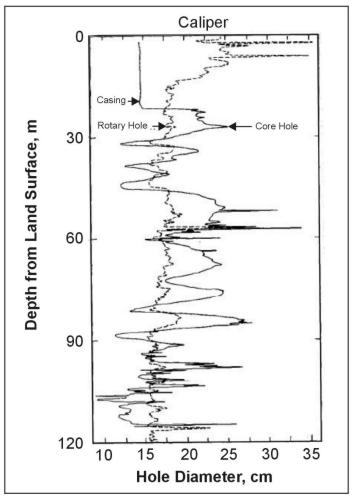
Figure 6. Effect of drilling technique on hole diameter. Holes are close together in an area of persistent lithology, Upper Brazos River basin, Texas.
The hydrostatic pressure of the fluid column is an important factor in preventing caving in poorly consolidated materials. This same pressure can cause invasion of an aquifer by the mud filtrate and the development of a filter cake or mud cake on the wall of the hole. Mud cake may reduce permeability and, thus, change results obtained from various flow logging devices. The thickness of mud cake often is related to the permeability and porosity of the rocks penetrated. Invasion by drilling fluids may change the conductivity of the pore water and reduce porosity and permeability in the vicinity of the drill hole. Hydraulic fractures can be induced in hard rocks by overpressure during drilling. One technique that is available for determining the extent of alteration of rock and fluid properties adjacent to the borehole is the use of different spacing between source and detector in acoustic or nuclear probes or between electrodes in resistivity probes. Longer spacing usually increases the volume of investigation or increases the percentage of the signal that is derived from material farther from the drill hole. The casing, cement, and gravel pack also have substantial effects on log acter. Well completion logs are designed specifically to provide information on the location and acter of casing and annular materials.
Operation of Equipment
If maximum benefit is to be obtained from an in-house logger that is purchased or rented on a long-term basis, an operator needs to be trained and assigned sole responsibility for the maintenance and repair of that unit. Logging equipment used by a number of people without adequate training and experience will have higher repair costs and more downtime than equipment assigned to one experienced person.
The larger logging service companies are based almost entirely on oil well operations; smaller companies rely mostly on environmental, engineering, water wells, or mineral exploration holes. Oil well logging equipment is larger and, therefore, more expensive, so that the costs-per-meter of log are much higher. Oil well logging probes may be too large for some environmental or engineering test holes, and a large drill rig is needed on the hole to suspend the upper logging sheave. A number of smaller local companies specialize in logging shallower, smaller diameter test holes or wells; some drillers own their own logging equipment. The smaller equipment owned by these companies may not include all the logging techniques available from the commercial service companies. Depth ges, standby time, and mileage costs will be lower for these small companies, but they may not have the calibration facilities common to the larger companies. The low bidder may not provide quality data, so proof of ability to perform should be required, and a written quality assurance and quality control program should be followed.
The total cost of commercial logging may be difficult for the inexperienced to calculate from price lists, because of the various unit costs involved. Depth and operation ges usually are listed per foot, and a minimum depth is specified. Mileage ges usually prevail over 250 km (150 miles) per round trip. The price of logging on environmental projects may be based on the following daily service ge:
a) Footage ges.
b) Mobilization.
c) Need for special health and safety measures or training.
d) Equipment decontamination.
e) Probe and cable loss insurance.
f) Crew per diem.
g) Any reports, special processing, or data processing required.
The well needs to be ready for logging when the equipment arrives because standby ges are relatively high. The customer is required to sign an agreement before any logging is done, stating that he assumes full responsibility for the cost of any probes that are lost, the cost of all fishing operations for lost probes, and the cost of any damage to the well. If a radioactive source is lost, fishing is required by law, and the well must be cemented up if the source is not recovered. The use of radioactive sources requires a written agreement, which must be addressed in the logging contract.
Quality Control
Control of the quality of geophysical logs recorded at the well site is the responsibility of all concerned, from the organization providing the logs to the analyst interpreting them; the ultimate responsibility lies with the professional who ordered and accepted the logs. No widely accepted standard or guidelines for log quality control exist at present; however, ASTM is presently working on a set of guidelines. Neither private logging companies nor government logging organizations accept responsibility for the accuracy of the data recorded. Agreements signed prior to logging by commercial companies usually include a disclaimer regarding the accuracy of the log data; therefore, the customer needs to assure that the best practices are followed. To obtain the most useful data, the logging program needs to be discussed early in the planning process with a local representative of the organization that will do the logging.
A geoscientist who understands the project objectives and the local geohydrology needs to be in the logging truck during the entire operation. The observer first will specify the order in which the logs will be run. Usually fluid logs will be run first, if the fluid in the well has had time to reach equilibrium. Nuclear logs always will be run last, or through drill stem if necessary, to reduce the possibility of losing a radioactive source. The observer usually makes preliminary interpretations of the logs as they come off the recorder. Based on immediate analysis, reruns can be requested if problems on the logs can be demonstrated. So many factors must be remembered by the observer to help control the quality of logs that many major oil companies provide a quality control checklist. Log headings that have blanks for a complete set of well and log data also can serve as partial quality control checklists. Incomplete log headings may prevent quantitative analysis of logs and make qualitative analysis much more difficult. Copies of digital data and field prints of all logs, including repeat runs, and field calibration or standardization should be left with the project manager before the logging equipment leaves the site. These data should be checked by a qualified person to determine if it is complete and without obvious problems before the logging equipment leaves.
Log headings may be divided into two basic sections: information on the well, and data pertaining to the logging equipment and operations. The completed heading needs to be attached to the analog record in the field. A short reference to the log heading information entered on the digital recording of each log enables the two records to be related. This reference will include the following information, as a minimum: hole number, date, log type, and run number. The format of a log heading is not important; the information is essential.
The well information section of the heading must contain all of the following, if available:
a) Well name and number.
b) Location ‑ township, range, section, distance from nearest town, etc.
c) Owner.
d) Driller, when drilled, drilling technique, and drilled depth.
e) Elevation of land surface.
f) Height of casing above land surface.
g) Depth reference.
h) Complete description of all casing, type, size, and depth intervals.
i) Location of cement, bentonite, perforations, and screens.
j) Drilled size(s) (or bit size) and depth intervals.
k) Fluid type, level, resistivity, and temperature.
The log information section of a heading will contain different information for each type of log, although the same heading can be used for similar logs. The following information is needed on the heading for each log:
a) Type of log, run (___ of ___), date.
b) Number or description of logging truck.
c) Logging operator(s), observers.
d) Probe number and description ‑‑ including diameter, type, detector(s), spacing, centralized or decentralized, source type and size, etc.
e) Logging speed.
f) Logging scales ‑ vertical (depth) and horizontal, including all changes and depths at which they were made.
g) Recorder scales ‑ millivolts (span) and positioning.
h) Module or panel settings ‑ scale, span, position, time constant, discrimination.
i) Power supply ‑ voltage, current.
j) Calibration and standardization data ‑ pre‑ and post‑log digital values recorded on heading and analog positions on logs.
k) List all other logs of the well run on the same date. Also briefly describe all problems or any unusual response during logging; mark at the appropriate depth on the log.
Calibration and Standardization
Logs need to be properly calibrated and standardized if logs are to be used for any type of quantitative analysis or used to measure changes in a groundwater system with time. Calibration is considered to be the process of establishing environmental values for log response in a semi‑infinite model that closely simulates natural conditions. Environmental units are related to the physical properties of the rock, such as porosity or acoustic velocity. Probe output may be recorded in units, such as pulses per second, which can be converted to environmental units with calibration data. Calibration pits or models are maintained by the larger commercial service companies; these are not readily available for use by other groups. The American Petroleum Institute maintains a limestone calibration pit for neutron probes, a simulated shale pit for calibrating gamma probes, and a pit for calibrating gamma spectral probes at the University of Houston; these have been accepted internationally as the standards for oil well logging. Boreholes that have been carefully cored, where the cores have been analyzed quantitatively, also may be used to calibrate logging probes. To reduce depth errors, core recovery in calibration holes needs to approach 100% for the intervals cored, and log response can be used to elect samples for laboratory analyses. Because of the possibility of depth errors in both core and logs, and of bed-thickness errors, samples need to be selected in thicker units, where log response does not vary much. It is advisable to have a well for periodic logging to determine if log response is consistent. A core hole is excellent for this purpose.
Standardization is the process of checking response of the logging probes in the field, usually before and after logging. Standardization uses some type of a portable field standard that usually is not infinite and may not simulate environmental conditions. Frequent standardization of probes provides the basis for correcting for system drift in output with time and for recognizing other equipment problems. The frequency of log standardization should be related to project objectives. If accurate data are needed, standardization should be more frequent.
The pages found under Surface Methods and Borehole Methods are substantially based on a report produced by the United States Department of Transportation:
Wightman, W. E., Jalinoos, F., Sirles, P., and Hanna, K. (2003). "Application of Geophysical Methods to Highway Related Problems." Federal Highway Administration, Central Federal Lands Highway Division, Lakewood, CO, Publication No. FHWA-IF-04-021, September 2003. http://www.cflhd.gov/resources/agm/
