Environmental Geophysics
Acoustic Logging
Acoustic logging includes those techniques that use a transducer to transmit an acoustic wave through the fluid in the well and surrounding elastic materials. Several different types of acoustic logs are used, based on the frequencies used, the way the signal is recorded, and the purpose of the log. All these logs require fluid in the well to couple the signal to the surrounding rocks. Four types will be described here: acoustic velocity, acoustic waveform, cement bond, and acoustic televiewer.
Basic Concept
Acoustic-velocity logs, also called sonic logs or transit-time logs, are a record of the travel time of an acoustic wave from one or more transmitters to receivers in the probe. Acoustic energy travels through the fluid in the well and through surrounding materials at a velocity that is related to the lithology and porosity of the rocks. Most acoustic-velocity probes employ magnetorestrictive or piezoelectric transducers that convert electrical energy to acoustic energy. Most of the transducers are pulsed from 2 to 10 or more times per second, and the acoustic energy emitted has a frequency in the range of 20 to 35 kHz. Probes are constructed of low-velocity materials, producing the shortest travel path for the acoustic pulse through the borehole fluid and the adjacent rocks, which have a velocity faster than that of the fluid. Acoustic probes are centralized with bow springs or rubber fingers so the travel path to and from the rock will be of consistent length. Some of the energy moving through the rock is refracted back to the receivers. The receivers reconvert the acoustic energy to an electrical signal, which is transmitted up the cable. At the surface, the entire signal may be recorded digitally for acoustic waveform logging, or the transit time between two receivers may be recorded for velocity logging. Amplitude of portions of the acoustic wave also may be recorded; that technique is described later under waveform logging.
Acoustic Energy Components
Acoustic energy transmitted in the borehole and adjacent rocks is divided into several components. The most important for this discussion are compressional (P) and shear wave (S) components. Standard acoustic-velocity logs are based on the arrival of the compressional wave. Compressional and shear waves at near and far receivers, along with the fluid waves that are transmitted through the borehole, are shown in figure 1 (Paillet and White, 1982). Most acoustic-velocity probes have paired receivers located a foot apart; some probes have several pairs of receivers with different spacing that may be selected from the surface. P-waves have a higher velocity and lower amplitude than shear waves, or S-waves. S-waves have a velocity about one- half that of P-waves and are characterized by particle movement perpendicular to the direction of wave propagation.
Data Acquisition
Tracking Circuits. Acoustic-velocity logging modules contain a tracking circuit that detects the arrival of the P-wave using a threshold amplitude or algorithm selected by the operator. If the waveform is digitized in the field, it is frequently possible to improve acoustic velocity logs by modifying the technique used to pick the first arrival. Amplitude of the transmitted signal and the received signal may be controlled from the surface, along with the height of the detection threshold. A circuit is employed to convert the difference in time of arrival at the two detectors to transit time (t) in ms/ft. Acoustic-velocity logs are recorded with interval transit time increasing from right to left; porosity also will increase to the left, as it does on conventionally plotted neutron and gamma-gamma logs.
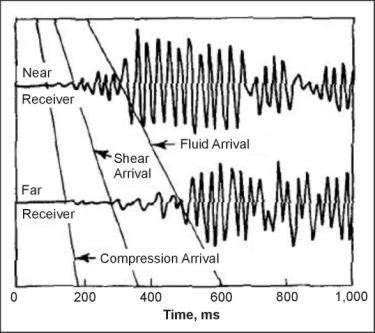
Figure 1. Acoustic waveforms for a two-receiver system.
Data Interpretation
For rocks with uniformly distributed, intergranular pore spaces, porosity usually is derived from the Wyllie time-average equation. This equation is based on the theory that the path of an acoustic wave through saturated rock consists of two velocities in series, the velocity in the fluid Vf, and the velocity in the rock matrix Vm. The length of the path in the fluid is equal to the porosity (F); the length of the path in the rock matrix is equal to 1‑F. The time-average equation can be expressed as:
![]() (1)
(1)
where
VL = velocity of the rock from a log.
For calculation of porosity, the time-average equation is converted to the form:
![]() (2)
(2)
where
tL = transit time from the log,
tm = transit time of the wave in the matrix,
tf = transit time in the fluid.
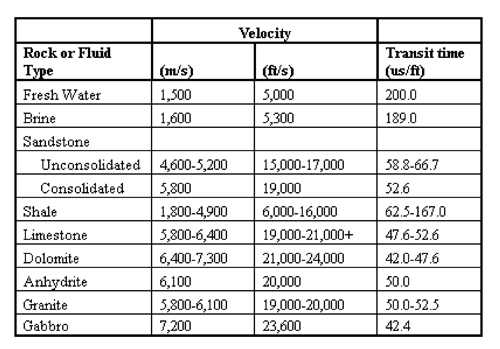
Velocities and transit times for some common rocks and fluids are provided in table 1. Note that the range can be very large, so laboratory measurements or background experience in specific rocks may be needed to calculate accurate porosities. The interval transit-time scale usually is accurate within 1 ms/ft on most acoustic-velocity logs; however, it should be checked, if possible. The difference in arrival of the P-wave at two receivers can be read directly from a calibrated oscilloscope, which is an essential part of any acoustic-logging system unless the waveform is digitized in the tool. In this case, a computer can be used to observe the waveforms. Calibration also can be accomplished using core samples analyzed in the laboratory for acoustic velocity and porosity. The response of a velocity probe can be checked onsite with a piece of steel pipe cut in half lengthwise. The tool can be laid in the pipe, and dams made at both ends with flexible caulking, so that half of the transmitters and receivers can be covered with water. Steel has a velocity ranging from 5,180 to 6,100 m/s (17,000 to 20,000 ft/s), which can be used to check the calibration of the sonde. It is possible to make the same check in a drill hole that contains free, hanging steel pipe.
Radius of Investigation. The radius of investigation of an acoustic-velocity probe is reported to be approximately three times the wavelength (Pirson, 1963). The wavelength is equal to the velocity divided by the frequency. At a frequency of 20,000 Hz, the radius of investigation theoretically is about 0.23 m for unconsolidated rocks with a velocity of 1,500 m/s, and 1.1 m for very hard rocks with a velocity of 7,600 m/s. A lower transmitter frequency will increase the volume of investigation, but it will decrease the resolution of small features, such as fractures.
Cycle Skipping. One of the most obvious problems on acoustic-velocity logs is cycle skipping, caused by the amplitude of the first compressional cycle being too low for detection, or by pre-arrival noise of sufficient amplitude to be detected. If the first cycle is detected at the near receiver, and the second cycle is detected at the far receiver, the resulting transit time will be much too long, and the log will show a very sharp deflection. Often signal amplitude will vary above and below detection level causing rapid fluctuations in the log trace, which can be recognized as cycle skips. Cycle skipping frequently is blamed on gas in the well; however, any condition that causes the compressional wave to drop below detection level will produce cycle skipping on the log. Causes include improper adjustment of signal or detection level, fractures or washouts, high-attenuation rocks, and gas in the fluid. Cycle skipping can be used to locate fractures in some wells, but corroborating evidence is necessary.
Lithologic Factors. Acoustic velocity in porous media is dependent on such lithologic factors as the type of matrix, density, size, distribution, and type of grains and pore spaces, degree of cementation, and the elastic properties of the interstitial fluids. The widely used time-average equation does not account for most of these factors, but it has been found to produce reasonably correct porosity values under most conditions. Figure 2 is a plot of porosity values measured on core versus transit time from an acoustic-velocity log for a sequence of basin-fill sedimentary and volcanic rocks in Idaho. The correlation coefficient for the core and log data from this well is 0.87, even though a wide range of rock types with different matrix velocities were logged. Acoustic-velocity logs are very useful for providing information on lithology and porosity under a fairly wide range of conditions. They usually are limited to consolidated materials penetrated by uncased, fluid-filled wells; however, lithologic information can be obtained when casing is well bonded to the rocks. Resolution of thin beds is good when 1-ft receiver spacing is used; contacts usually are marked by sharp deflections.
Table 1. Compressional-wave velocity and transit time in common
rocks and fluids (single values are averages).
Secondary Porosity. In some geohydrologic environments, such as carbonates, porosity from an acoustic-velocity log and from a neutron log or core can be cross-plotted to identify intervals of secondary porosity. Acoustic-velocity logs do not detect most nonuniformly distributed secondary porosity, whereas neutron logs respond to all water-filled pore spaces.
Basic Concept
Considerable information on lithology and structure is available through analyses of the various components of a received acoustic signal. Analyses may include amplitude changes, ratios of the velocities of various components of the wave train, and frequency-dependent effects. Hearst and Nelson (1985) present a broad discussion on acoustic logging and the propagation of waves in geologic media. There are two main categories of waves in a borehole: refracted waves and guided waves. Refracted waves travel from the transmitter through the fluid and are refracted at the borehole wall, where they travel through the rock until refracted again through the fluid to the receivers. Guided waves travel in the borehole fluid or at the borehole wall/fluid interface. Cement-bond logs are included in this section, because waveform data are needed to increase the accuracy of interpretation of these logs. Acoustic waveforms can be recorded digitally, Normal can be made of the display on an oscilloscope, or a variable-density log can be made. The variable-density log (VDL) or three-dimensional (3‑D) velocity log is recorded photographically, so that variations in darkness of the record are related to changes in amplitude of cycles in the waveform. Figure 3 includes a VDL display. The banded display on the right is the VDL, which is a representation of the wave train in time from transmitter pulse. Frequency of the waves is related to the width of the black and white or gray bands. The gray scale scheme in this VDL is such that white represents high-amplitude negative wave pulses, gray the low-amplitude waves, and black represents high-amplitude positive pulses. A digitized waveform log is the most useful type of record, because data can be analyzed quantitatively. Velocities and amplitudes of all parts of the recorded waveform can be measured from a digital record. Furthermore, digitized waveform data enable acoustic velocity or transit time logs to be corrected later where the algorithm that detected the first arrival was not functioning properly.
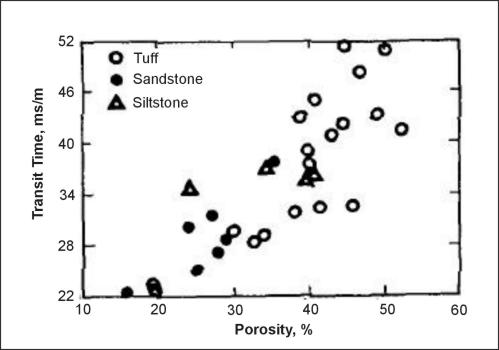
Figure 2. Relation of acoustic-transit time to porosity for a tuff, sandstone and siltstone, Raft River geothermal reservoir, Idaho.
Data Interpretation
Elastic properties of rocks can be calculated from the velocities of P- and S-waves and from corrected bulk density from a gamma-gamma log. The elastic properties or constants that can be determined are shear modulus, Poisson's ratio, Young's modulus, and bulk modulus (Yearsley and Crowder, 1990). The shear modulus is defined in terms of density and S-wave velocity, as given in the following equation:
![]() (3)
(3)
where
G = shear modulus,
pb = bulk, mass density,
Vs = shear-wave velocity.
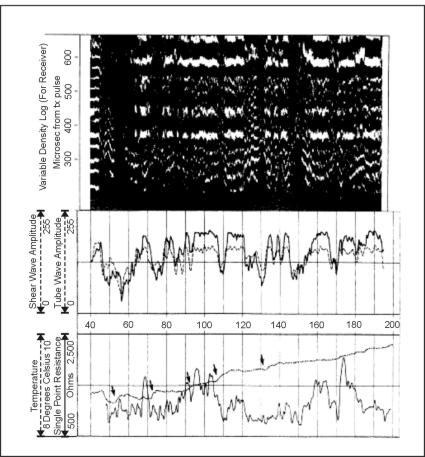
Figure 3. Composite of logs showing the location of permeable fractures indicated by the arrows at changes in temperature gradient and by low tube and shear wave amplitude. (Yearsley and Crowder, 1990; copyright permission granted by Colog, Inc)
Poisson's ratio n is the ratio between strain in the direction of principal stress and strain in either transverse direction, and is defined in terms of P- and S-wave velocities by the following:
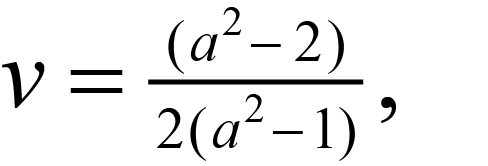 (4)
(4)
where
n = Poisson's ratio,
a = Vp/Vs,
Vp = P-wave velocity.
Young's modulus is the factor of proportionality between stress and strain and is fundamentally related to the material constants given above by the following equation:
![]() (5)
(5)
where
E = Young's modulus.
It should be noted that the above relationships were derived for homogeneous, isotropic conditions, which do not exist in the geologic environment. Still, in practice, these expressions provide useful engineering estimates for the elastic properties of rocks, and an analytical overview of the interrelationships among density, velocity, and moduli. For example, equation 3 reveals that the shear modulus varies directly with density, but with the square of shear velocity, indicating the strong dependency of the shear modulus on transverse velocity. It is interesting to note from equation 3 that Poisson's ratio is not physically meaningful for compression/shear velocity (Vp/Vs) ratios less than 1.42 (Poisson's ratio becomes negative). In general, higher Poisson's ratios indicate less competent rock. Ice, which is more deformable than most rock, has a Vp/Vs ratio of approximately 2.0, which corresponds to a Poisson's ratio of 0.33. The result of this type of analysis is the engineering properties log shown in figure 4. Competent rock below 44 m stands out clearly in figure 4, with moduli of nearly twice the weathered rock and five times the fractured rock. However, note the minor fracture zones in evidence in the competent rock mass, indicated by excursions to the left on both the moduli curves and velocity curve. The major fracture zones in the overlying rock are shown by extremely low shear moduli of less than 14 GPa (two million psi). The core-derived rock quality determination plotted in figure 4 grossly indicates the difference between the competent rock mass and the overlying weathered and fractured rock in this core hole.
Tube Waves. Paillet (1980 and 1981) describes the Characterization of fractures by various acoustic techniques. A significant finding was that a semiquantitative correlation exists between the attenuation of tube-wave amplitude in small-diameter drill holes in crystalline rocks and the permeability of fractures determined by packer-isolation tests. Thus, tube-wave amplitude logging has the potential for predicting the relative flow through fractures in hard rocks. The tube wave is part of the fluid wave propagated along the borehole wall under certain conditions; it apparently is attenuated where water in the borehole is free to move in and out of fractures. Figure 5 shows the correlation between a tube wave amplitude log calculated from digitized acoustic waveform data and fracture aperture or permeability from straddle packer tests (Davison, Keys, and Paillet, 1982). Figure 3 is a composite log including shear and tube wave amplitude, temperature, single point resistance, and VDL. VDL indicates fractures as the low-velocity zones. The single point resistance is primarily controlled by the presence or absence of fractures. Natural flow in or out of the borehole through fractures affects the thermal gradient of the borehole fluid so that changes noted on the temperature log by arrows indicate natural fracture flow. The amplitude logs in figure 3 were computed by calculating the root mean square amplitude within specified time windows. Two additional fracture zones evident on the VDL, and as low-amplitude excursions on the amplitude logs at 44.5 ‑ 45 and 52 m are not obvious on the temperature log.
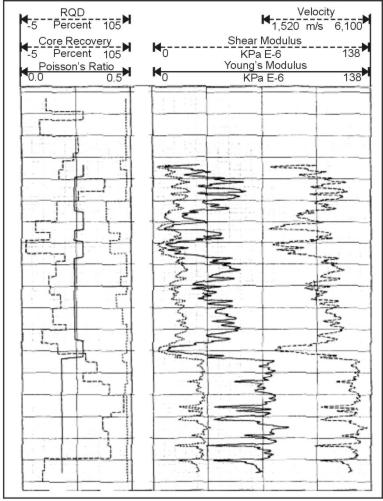
Figure 4. Engineering properties calculated from geophysical logs of a core hole compared with rock quality determination (RQD) from the core. (Yearsley and Crowder, 1990; copyright granted by Colog, Inc)
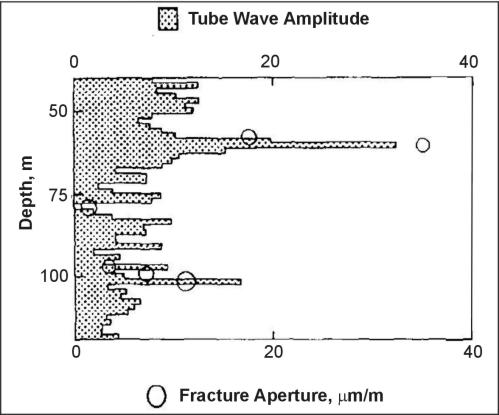
Figure 5. Plot showing a comparison of a tube wave amplitude calculated from acoustic waveform data and hydraulic fracture aperture calculated from straddle packer tests.
Cement-bond logging usually employs a single receiver to obtain information on the quality of the bond between casing and cement and between cement and borehole wall. Most cement-bond logs are a measurement only of the amplitude of the early arriving casing signal, but to improve the accuracy of interpretation, the full acoustic wave form is needed for study. Although a small amount of the total acoustic energy may be received from the rock when the casing is free to vibrate, the formation signal usually is not detectable. The detection of channeling through cement in the annular space is one of the main objectives of cement-bond logging; yet, even an expert in the analysis of cement-bond logs probably will not locate all channels accurately.
Basic Concept
An acoustic televiewer (ATV) is a logging device that can provide high-resolution information on the location and acter of secondary porosity, such as fractures and solution openings. It also can provide the strike and dip of planar features, such as fractures and bedding planes. An ATV also is called the borehole televiewer, but this term occasionally causes it to be confused with borehole television. An ATV employs a rotating high-frequency transducer that functions as both transmitter and receiver (Zemanek, et al., 1969). The piezoelectric transducer is rotated at three or more revolutions per second and is pulsed approximately 1,200 times per second. High-frequency acoustic energy is reflected from, but does not penetrate, the borehole wall. A trigger pulse is transmitted to the surface equipment from a flux-gate magnetometer each time the transducer rotates past magnetic north. This pulse triggers the sweep of an oscilloscope or graphic recorder, so that each sweep represents a 360º scan of the borehole wall. The brightness of the oscilloscope trace is proportional to the amplitude of the reflected acoustic signal, somewhat analogous to a rotating depth finder in a boat.
Data Acquisition
The probe must be centralized accurately with bow springs so the signal path will be the same length in all directions. As the probe moves up the hole, a signal is generated that moves the sweeps across the oscilloscope or other type of graphic recorder to produce a continuous record of the acoustic reflectivity of the borehole wall. The received signal may also be recorded in analog format on standard VHS tape for later playback and enhancement of the graphic record. The signal from the ATV probe may be digitized in new generation probes or subsequently from the VHS analog tape from older systems. The digital data file may then be enhanced, analyzed, and displayed in various color formats using a computer program. This program, and similar programs developed by logging companies, produces three-dimensional plots, calculates the aperture and strike and dip of fractures, the orientation of breakouts, borehole diameter, acoustic reflectivity, stress field, etc. The ATV log is a cylinder that has been opened along the north side and flattened, as illustrated in figure 6. In this figure, an open fracture dipping to magnetic south is shown intersecting a drill hole in a three-dimensional drawing on the left. The hypothetical televiewer log on the right shows the fracture as it might appear, as a dark sinusoid, with the low point oriented toward magnetic south. The transducer rotates clockwise, as viewed looking down the well; thus, compass directions are in the order shown at the bottom of the log. Fractures and other openings in the borehole wall or in casing appear as dark areas for several reasons. Increasing well diameter means the acoustic signal must travel farther, and that it will be more attenuated by the fluid in the borehole. In addition, part of the surface of fractures and other openings is not at right angles to the incident acoustic signal, so that it is not reflected back to the transducer.
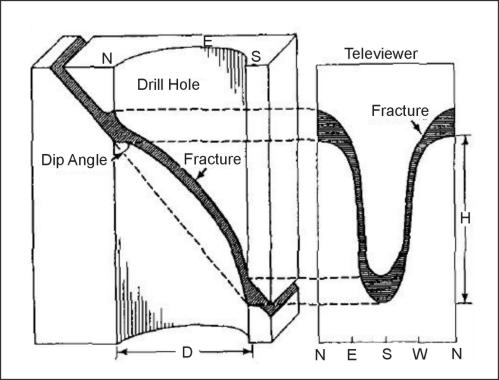
Figure 6. Three-dimensional view of a fracture and appearance of the same fracture on an acoustic televiewer log. D is borehole diameter and h is the length of the fracture intercept in the borehole.
Acoustic Caliper Log. Modifications to ATV equipment permit recording an acoustic-caliper log, which consists of four high-resolution traces. Use of a lower frequency transducer provides better penetration of casing, and the tool can be used to examine cement in the annular space. Broding (1984) demonstrated the ability of a lower frequency probe to locate voids and channels in cement that were not detected by other logging methods. Acoustic televiewer logs, made in steel casing or in the presence of large concentrations of magnetic minerals, are not oriented, because the magnetometer will not work under these conditions. A switch in the tool can be used for triggering the sweep instead of the magnetometer; as a result, compass orientation of the edge of the log will rotate as the tool is brought up the hole.
Quantitative Output. Two quantitative outputs of the acoustic televiewer occur that may require calibration and occasional standardization onsite. The magnetometer needs to be checked with a compass to determine if it triggers on magnetic north within a degree, if possible; this can be accomplished by using a narrow reflective object in a plastic bucket filled with water. The lower set of centralizers usually is removed for this procedure. If an acoustic-caliper log is to be run, hole-diameter response needs to be checked.
Volume of Investigation. The concept of volume of investigation does not apply to the televiewer in a strict sense because, with the typical high-frequency transducer, most of the signal is received from the wall of the borehole. Even if the frequency is reduced to half the usual value, rock penetration is small. However, acoustic-televiewer probes have mechanical and electronic limits to the diameter of the well that can be logged. The operating range of borehole diameter for most tools is from 76 to 400 mm.
Data Interpretation
An acoustic televiewer provides a record of the location, acter, and orientation of any features in the casing or borehole wall that alter the reflectivity of the acoustic signal. These include diameter and shape of the drill hole, wall roughness that may be caused by drilling procedures or lithology, differences in rock hardness, and structural features like bedding, fractures, and solution openings. The smallest feature that can be resolved on an ATV log depends on a number of factors such as hole diameter and wall roughness. Under the right conditions, features as small as 1 mm, or possibly even smaller, can be identified. Figure 7 is a comparison of fractures detected by borehole television, detailed core description, and by the acoustic televiewer at a reactor site in Canada (Davison, Keys, and Paillet, 1982). The first two are diagrammatic reconstructions of the fractures, and the ATV log is a copy of the field log. The ATV shows all of the open fractures that are likely to be capable of transmitting water. Borehole television or video missed some of these fractures, and some of the fractures shown as dashed on the core log are actually only visible with a hand lens. Paillet (1994) discusses the televiewer and other techniques used to acterize flow in fractured rocks.
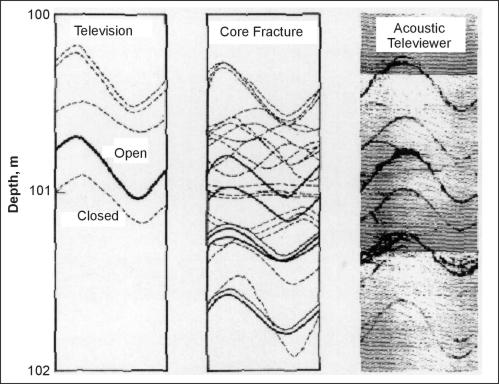
Figure 7. Diagram showing comparison of reconstructed fracture data from borehole television, and a detailed core log, with a copy of an acoustic televiewer log.
Acoustic Televiewer Applications
A televiewer log of a fracture-producing zone in a geothermal well at Roosevelt Hot Springs, Utah, is shown in figure 8. Acoustic- and mechanical-caliper logs of this zone are shown in figure 9. These logs were made at temperatures as high as 260°C (Keys, 1979). The fracture-producing interval shown in figure 7 is approximately 1.2 m thick; it apparently is the result of alteration and solution along a series of subparallel fractures seen as black sinusoids in the figure. The fracture at the top of the interval appears to be about 150 mm wide, based on the log; it is probably much less. Fractures tend to be broken out during drilling, and the broken edges further increase the apparent thickness on the log by refracting the acoustic signal. This is particularly evident at the top and bottom of the sinusoid on steeply dipping fractures, as illustrated in figure 6. The open fracture in the fracture-producing zone is paralleled by one relatively tight fracture above, and probably six fractures below, which produced a brecciated, and probably altered, permeable zone. The effect of drilling technique and lithology on the interpretation of fracture acter from ATV logs is discussed by Paillet, Keys, and Hess (1985). Log quality generally is not as good where the wall of the hole is rough, or where rocks are soft.
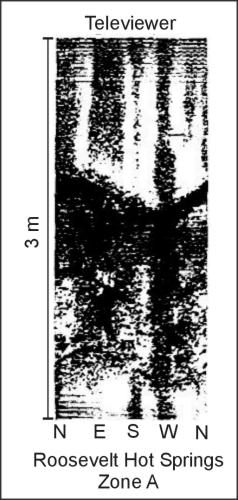
Figure 8. Acoustic-televiewer log of fracture-producing zone A in a geothermal well, Roosevelt Hot Springs, Utah.
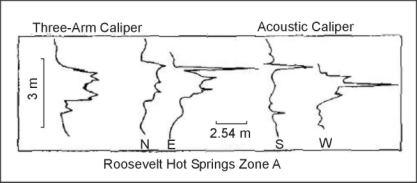
Figure 9. Mechanical and acoustic-caliper logs of fracture-producing zone A in a geothermal well, Roosevelt Hot Springs, Utah.
Strike and Dip. To calculate the strike and dip of fractures or bedding, the following information is needed: the vertical intercept distance on the ATV log H as shown in figure 6; the direction of dip from the ATV log; and, the hole diameter D from a caliper log. The same measuring units must be used for H and D. The angle of dip, in degrees, is equal to the arc tangent of H/D. If the average H for the fractures in figure 6 is 12 in, and the hole diameter is 6 in, the dip would be 63º; if the hole diameter is 12 in, the dip would be 45º. Direction of dip usually can be measured to the nearest 5º, using a 360º scale constructed to fit the width of the ATV log. The average direction of dip of the fractures in figure 8 is slightly south of west.
Orientation of the Stress Field. Orientation of the stress field may be determined from an analysis of ATV logs made in wells where fractures have been induced hydraulically, either intentionally or accidentally, by drilling (Wolff, et al., 1974; Keys, et al., 1979). Hydraulic fractures are oriented perpendicular to the direction of least principal stress. Hydraulic fractures accidentally induced during drilling may provide permeable pathways for waste migration at environmental sites. Breakouts are increases in borehole diameter oriented at right angles to the maximum, principal, horizontal stress. They are easily recognized on ATV logs and have been discussed in detail by Paillet and Kim (1985). Breakouts appear as two vertical dark bands with irregular margins located approximately 180º apart on the log.
Casing Examination. The acoustic televiewer can also be used to examine casing for holes and to locate joints in pipe and well screens; borehole television might be better for these purposes if the water is clear and the walls are clean. Above the water level, television needs to be used, because the ATV will not operate.
Extraneous Effects. Interpretation of televiewer logs is complicated by a number of extraneous effects. Most significant are poor centralization, incorrect gain settings, errors from borehole deviation, and aberrations in the magnetic field. Significant deviation from vertical is common in deep drill holes, which introduces several errors on ATV logs. In addition to the obvious error in the measured vertical depth, corrections must be made to dip and strike calculated from ATV logs in deviated holes. Boreholes are not usually round, and this produces vertical black bands on ATV logs. Poor tool centralization in deviated wells produces similar features on the logs. Choosing the proper gain setting for the tool is a matter of operator experience and is quite important in producing high- quality logs.
The pages found under Surface Methods and Borehole Methods are substantially based on a report produced by the United States Department of Transportation:
Wightman, W. E., Jalinoos, F., Sirles, P., and Hanna, K. (2003). "Application of Geophysical Methods to Highway Related Problems." Federal Highway Administration, Central Federal Lands Highway Division, Lakewood, CO, Publication No. FHWA-IF-04-021, September 2003. http://www.cflhd.gov/resources/agm/
