Environmental Geophysics
Marine Magnetic Methods
Magnetic methods, as employed in marine applications, differ little in theory from surface magnetic surveys. The instrument measures the earth’s total magnetic field at each measurement location. However, practical applications of field techniques, field equipment, and geographic control can vary greatly between surface and marine surveys.
In the case of marine surveys, the magnetometer is generally a towed sensor. The Geometrics G-882 is one example of a marine magnetometer and can be seen in figure 1. Positional control is generally provided by a global positioning system (GPS) where the GPS sensor is mounted on the vessel towing the magnetometer, with a constant offset equal to the distance from the GPS sensor to the magnetometer sensor.
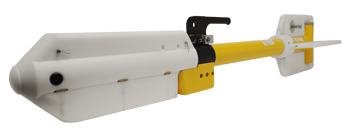
Figure 1. The Geometrics G-882 marine magnetometer sensor, taken from www.geometrics.com. This image is provided for demonstration purposes, and is not intended as an endorsement for use of this product.
As in the use of surface magnetic surveys, applicable targets in marine applications are any ferrous objects of sufficient size depending on the measurement spacing or resolution. Additionally, gradiometric measurements, measurements where two or more sensors are used to remove the background magnetic field, can be acquired in both the vertical and horizontal planes. When applied in the horizontal plane it has been referred to as transverse gradiometry.
Case Study
Applications of marine magnetic surveys can range from archaeological mapping of ship wrecks or flooded archaeological sites to geologic structure mapping and contaminant transport mapping (Bowens 2009, Boyce 2002). Archaeological investigations of a historic harbor off the coast of Israel, completed by Boyce et al (2002, 2003, 2004), is used in the following section to illustrate one possible equipment configuration, survey coverage, and resulting data. Figure 2 presents one example of a marine magnetic survey field configuration (Boyce 2003). Figure 3 is an example of a survey tracking map showing the gps coordinates of the survey lines. This indicates coverage and orientation of the survey. Resulting data from marine magnetic surveys, like surface surveys, are generally presented in 2D contoured plan view images (Figure 4). The bathymetry data are presented to the left of the total magnetic field data. The magnetic responses correlate to historic structures and geologic formations. Figure 5 presents a conceptual schematic of integrated marine survey instrumentation configured for an archaeological survey where, magnetics (1), sidescan sonar (2), sub-bottom profiler (3), and a remotely operated vehicle (4) are illustrated (Bowens 2009).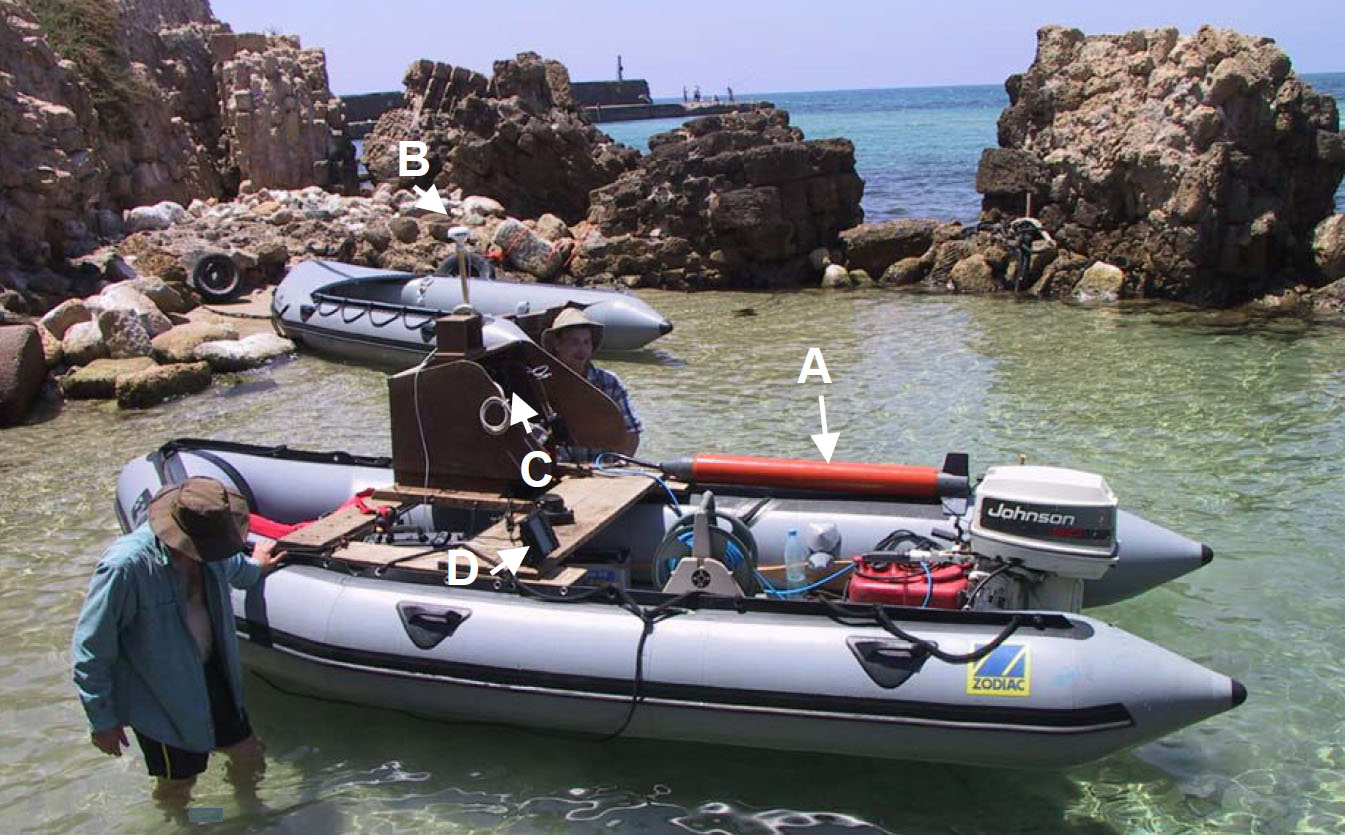
Figure 2. Zodiac inflatable boat used to collect the magnetic and bathymetric data at Caesarea. a) Marine Overhauser magnetometer (Marine Magnetics ‘ SeaSPY’), b) GPS antenna, c) Data logging computer, d) Navigation and echo sounder display (adapted from Boyce 2003). This image is provided for demonstration purposes, and is not intended as an endorsement for use of any of the pictured products.
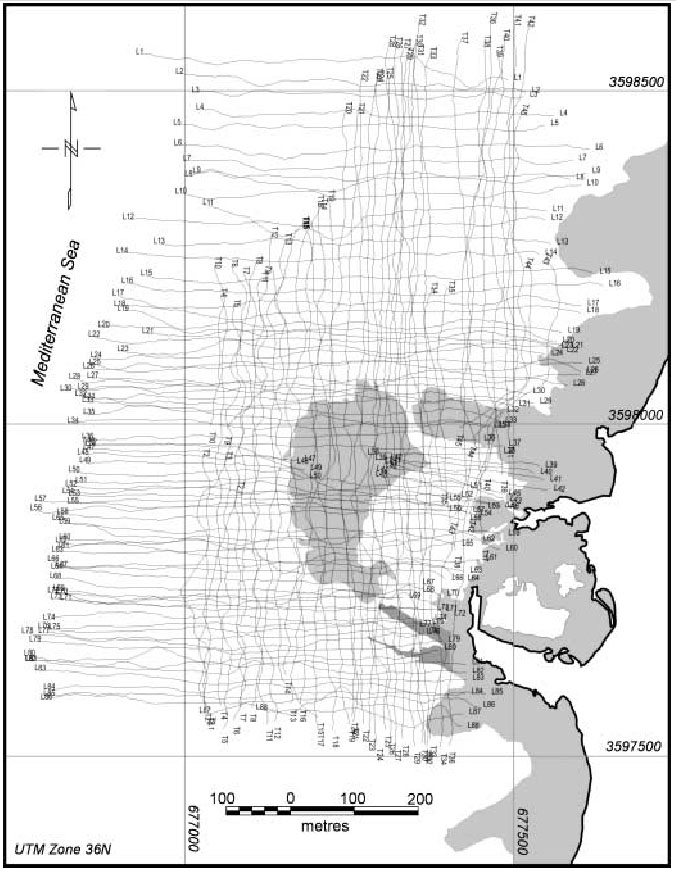
Figure 3. Magnetic survey tracklines (total 107 line km). No data were acquired within the inner harbour area due to high magnetic gradients associated with the modern harbour entranceway (adapted from Boyce 2003).
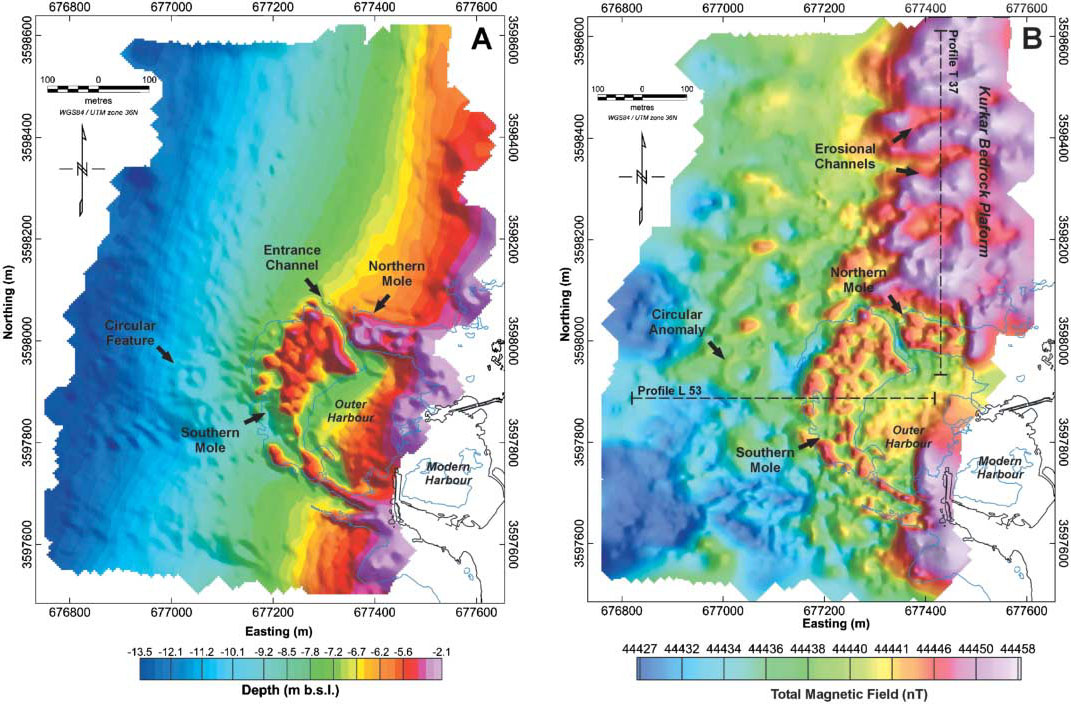
Figure 4. 2D contoured bathymetry and magnetics data, presented as a 3D shaded relief map. Peaks indicate area of increased magnetic intensity (adapted from Boyce 2003).
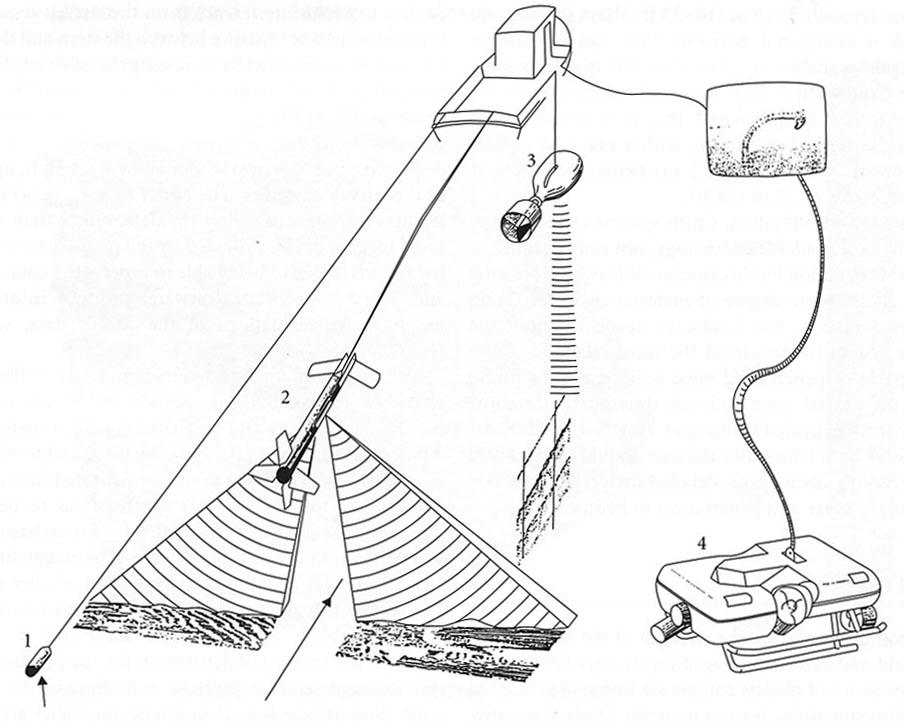
Figure 5. A conceptual schematic of integrated marine survey instrumentation configured for an archaeological survey where, magnetics (1), sidescan sonar (2), sub-bottom profiler (3), and a remotely operated vehicle (4) are illustrated (Bowens 2009).
