Environmental Geophysics
Marine Resistivity Methods
Resistivity methods, as employed in marine applications, differ little in theory from ground based resistivity surveys. A sound wave generating device is used to transmit a sound wave, while receiving devices measure the amplitude and arrival times of the returned (reflected /refracted) signals. However, practical applications of field techniques, field equipment, and geographic control can vary greatly between surface and marine surveys.
In the case of marine surveys, the instrumentation is generally a towed current electrode, or transmitter, and an array of potential electrodes or receivers (figure 1). Given the difficulty associated with establishing straight survey lines while in a vessel, and the necessity to image deep structures, the field equipment can be cumbersome. Figure 2 demonstrates deployment of a marine resistivity acquisition system. Not pictured here are the additional components necessary for data processing such as GPS, depth finders, and temperature recording devices. Many manufacturers offer specialized acquisition and processing software that integrates all of the above data types. Positional control is generally provided by a global positioning system (GPS) where the GPS sensor is mounted on the vessel towing the array, with a constant offset equal to the distance from the GPS sensor to the electrode array.
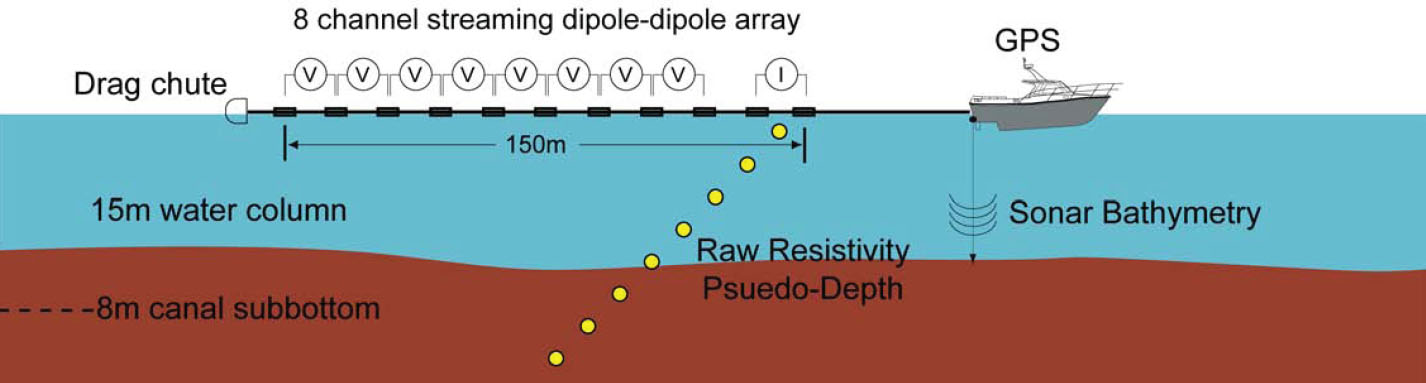
Figure 1. An illustration adapted from an educational website on petroleum illustrates the basic application of seismic data acquisition in a marine setting (http://openlearn.open.ac.uk/mod/resource/view.php?id=172129). This image is provided for demonstration purposes, and is not intended as an endorsement for this website.
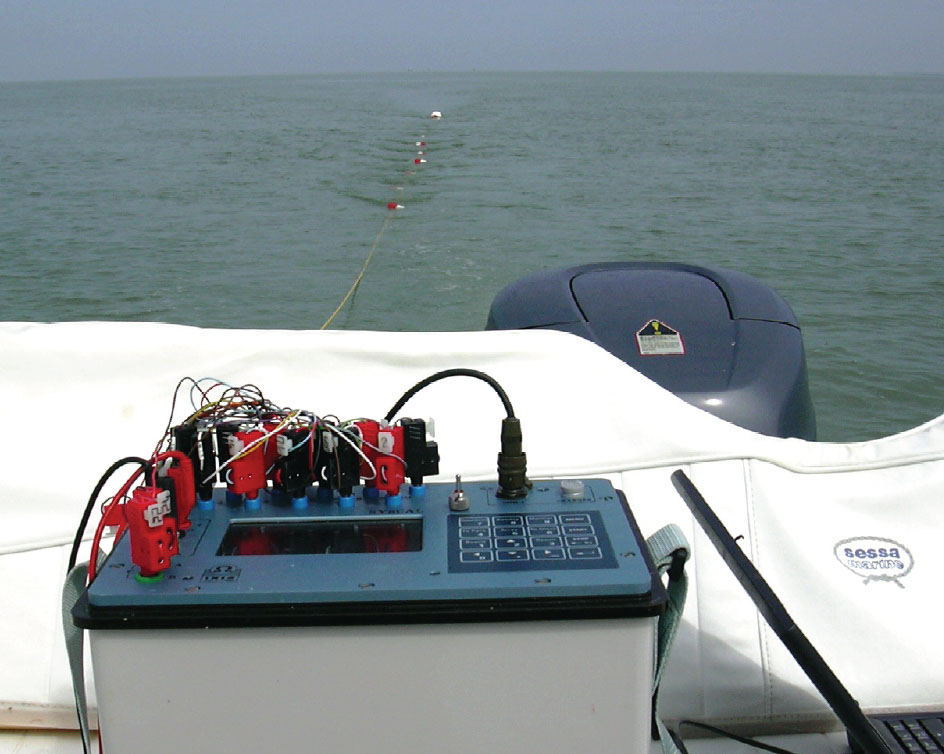
Figure 2. Illustration showing one technique for marine resistivity data acquisition (http://www.terraplus.ca/html/whats-new.html ). This image is provided for demonstration purposes, and is not intended as an endorsement for use of any of the pictured products.
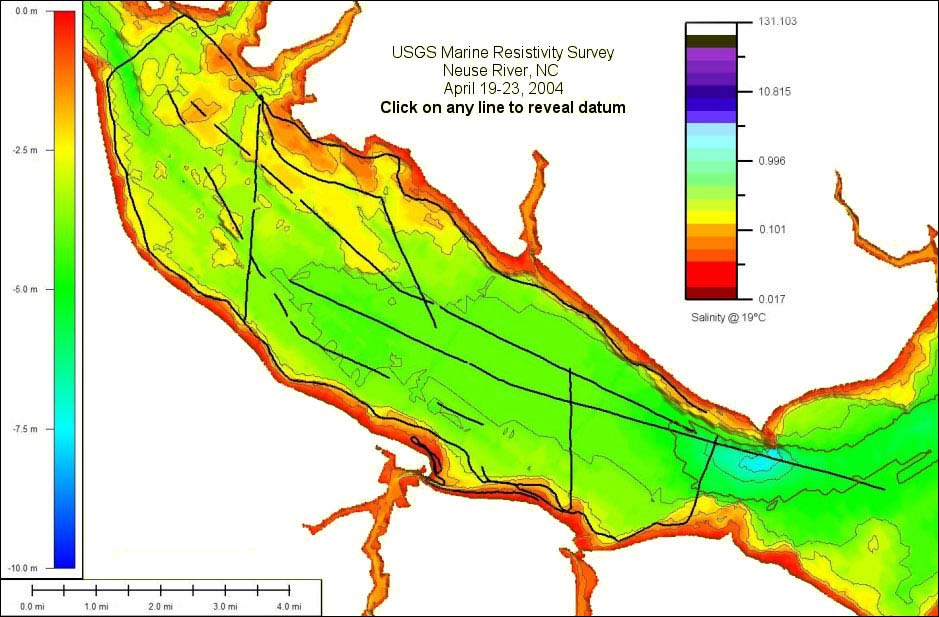
Figure 3. Marine Resistivity survey coverage and bathymetry map. Black lines indicate resistivity profiles (http://nc.water.usgs.gov/ccp/2004Crystal/data/resistivity/noframeindex.html ).
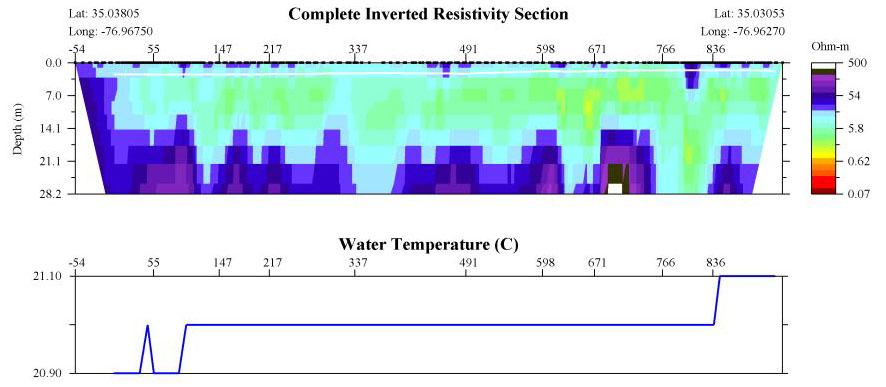
Figure4. Example of marine resistivity data acquired from a USGS investigation in coastal North Carolina, note the correlation of temperature with the variations in resistivity (http://nc.water.usgs.gov/ccp/2004Crystal/data/resistivity/noframeindex.html ).
